Thinking, fuzziness, and constraints
Computers can be great at solving logic problems like the ones mentioned above, as long as we can describe them in a formally correct and detailed way. Special programming languages and techniques—theorem provers—exist, and can calculate solutions for huge datasets. These languages are most often used by mathematicians to help with proving formal theorems, or by domain experts to aid in modeling large scale industrial production systems.
These programming languages are useful after we have encoded a problem in machine-readable form, but first we must do the harder part: fully understand the problem. For this we often reach for pen and paper, which allows us to think fuzzily and omit various levels of detail when problem-solving. We can quickly sketch out the representation of the problem without worrying about absolute correctness.
This project explores what it might look like if computers could support this style of early-stage thinking. Untangle is specifically not a tool for solving artificial logic puzzles, nor is it a tool for creating formal specifications for industrial systems. Instead, we’re interested in a tool that can help us think through ill-defined problems, understand compromises, and learn about what kind of questions to ask.
Untangle is a continuation of the threads highlighted in the thinking, modeling, and computers section of the Crosscut essay. Mainly, we want a tool in which we can sketch a dynamic representation of the problem at hand and have a conversation with it.
Design principles
- Keep focus on the problem, not the implementation
We want a tool in which your focus remains on the problem at hand as much as possible, rather than thinking about the correct way to encode it in a machine-readable way. - No errors, undefined values, or unknown parameters to fill in
The tool should never block, freeze, or become unresponsive, even if the user creates invalid states such as errors or incomplete input. A wrong answer is better than no answer. - Everything is visible.
Both the domain model and the constraints should always be visible and interactive. - Conversation with the material is be encouraged.
We want an iterative approach to problem solving—one where observing leads to thinking, which leads to acting, which leads back to observing. You should be able to intuit connections between various rules and constraints by wiggling them and seeing other things wobble.
We also adopted most of the design principles from Crosscut:
- A tablet & stylus can become dynamic pen & paper.
- The content of what you’re working on is the most important thing.
- You shouldn’t have to use an on-screen keyboard for programming.
- This is a personal thinking space.
There’s one important design difference from Crosscut: using hand-drawn strokes instead of vector graphics. We believe there’s something special about leaving distinctively human marks on the page with a stylus, so we want to go back to hand-drawn marks like with Inkbase, but with an entirely different computational model
Inspirations
Logic programming
Logic programming is an important paradigm in computer science. It is based on formal logic, and allows programmers to describe problems using declarative statements (“every human is mortal”), and ask questions based on these statements (“X is human; is X mortal?”).
Some notable logic programming languages include:
- Prolog, one of the first logic programming languages, widely used for theorem proving, term rewriting, automated planning.
- Z3 Theorem Prover, a satisfiability modulo theories (SMT) solver that is targeted at software verification and program analysis. Untangle uses Z3 as a library for solving.
- Alloy Analyzer, Alloy is a language for describing and exploring software models. It has been used in a wide range of applications from finding holes in security mechanisms to designing telephone switching networks. Of particular interest is Alloy’s IDE that visualizes a possible structure based on the constraints provided by the user.
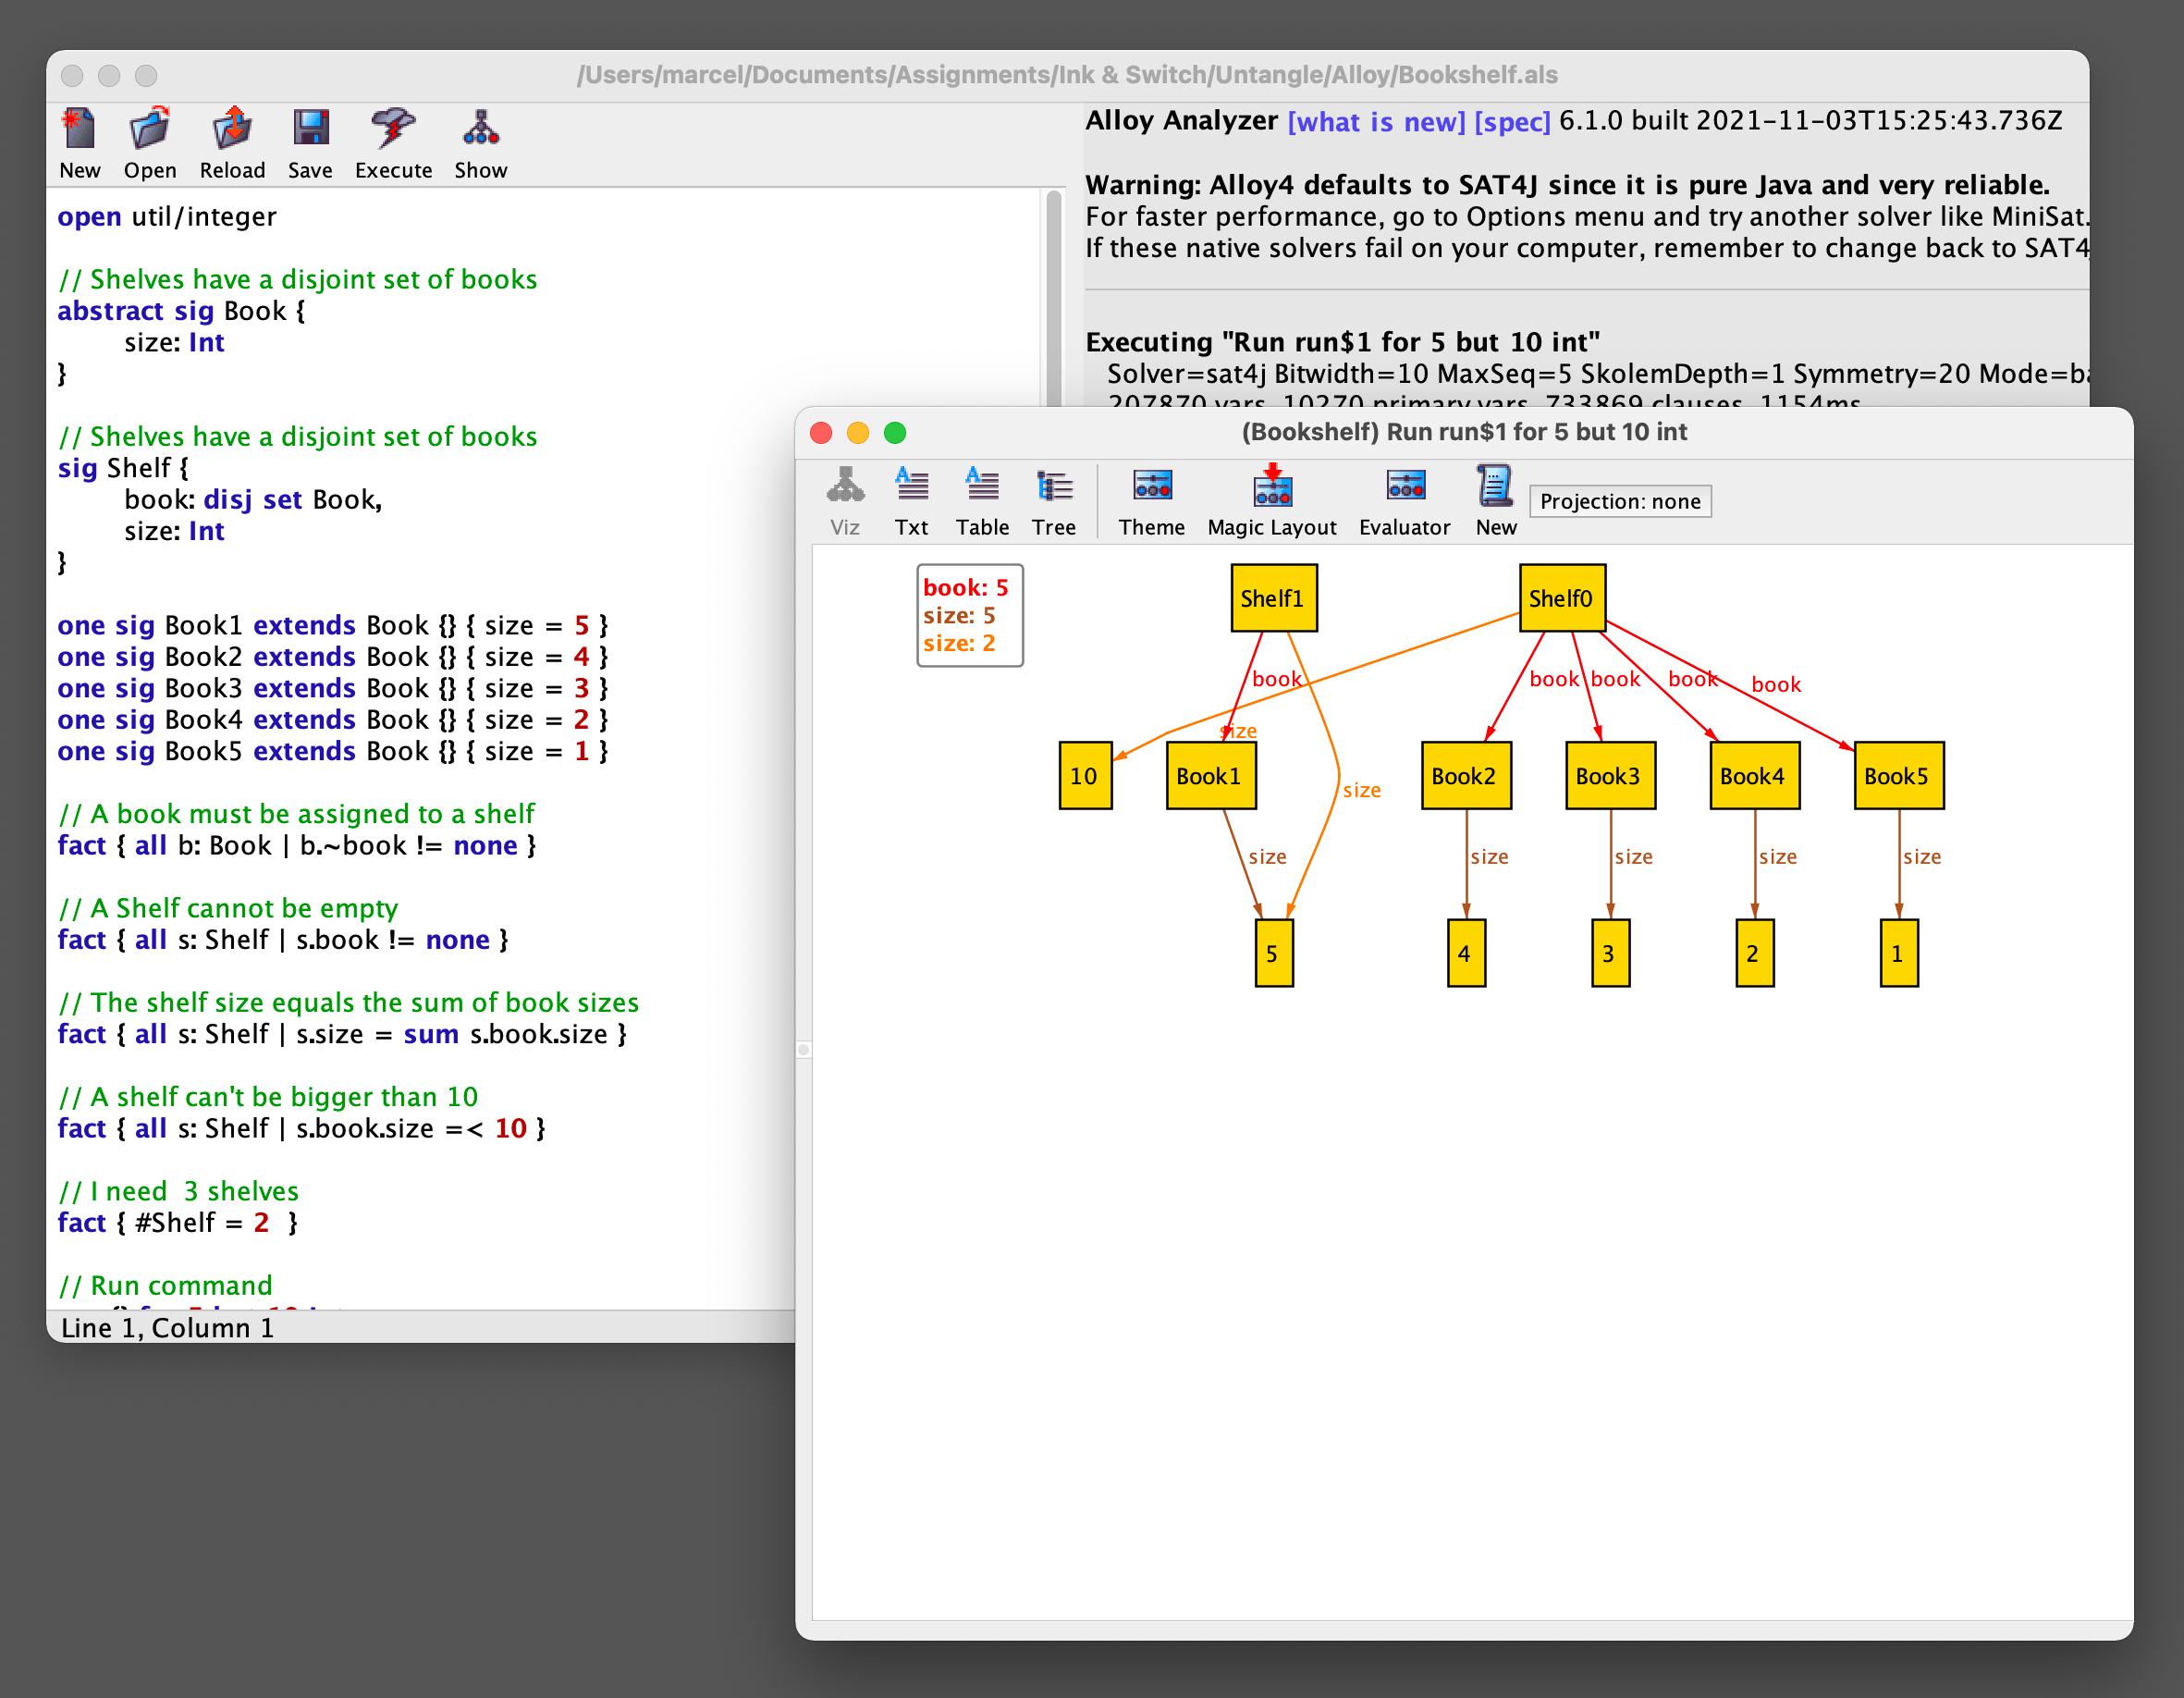
Alloy Analyzer’s interactive solver visualization.
Pattern matching
Untangle relies heavily on spatial queries—finding symbols on the page by their spatial relation to other known symbols—which were inspired by:
- Regex, a domain-specific language for describing search patterns in text.
- Qualitative Spatial Reasoning, a calculus which allows a machine to represent and reason about spatial entities without resorting to traditional quantitative techniques. QSR is often used in GIS (Geographic Information Systems) for querying geographical data.
Graphical production systems
Work on Untangle was also inspired by graphical production systems which use shape matching rules and graphical rewrites to describe computations.
Publications that guided our work:
- Shape Grammars and the Generative Specification of Painting and Sculpture, a seminal paper by Stiny and Gips introducing shape grammars.
- New graphical reasoning models for understanding graphical interfaces, a paper from Furnas introducing BICPICT, a pixel-rewriting graphical reasoning system.
- Wave Function Collapse, an approach for generating tile maps from a single example, which influenced our thinking on using superposition as a mental model for working with multiple possible values.
Wave Function Collapse algorithm visualzation. Figure by Maxim Gumin.
Real-world applications of logic programming
Finally, we were guided by various examples of using theorem provers for working through everyday problems.
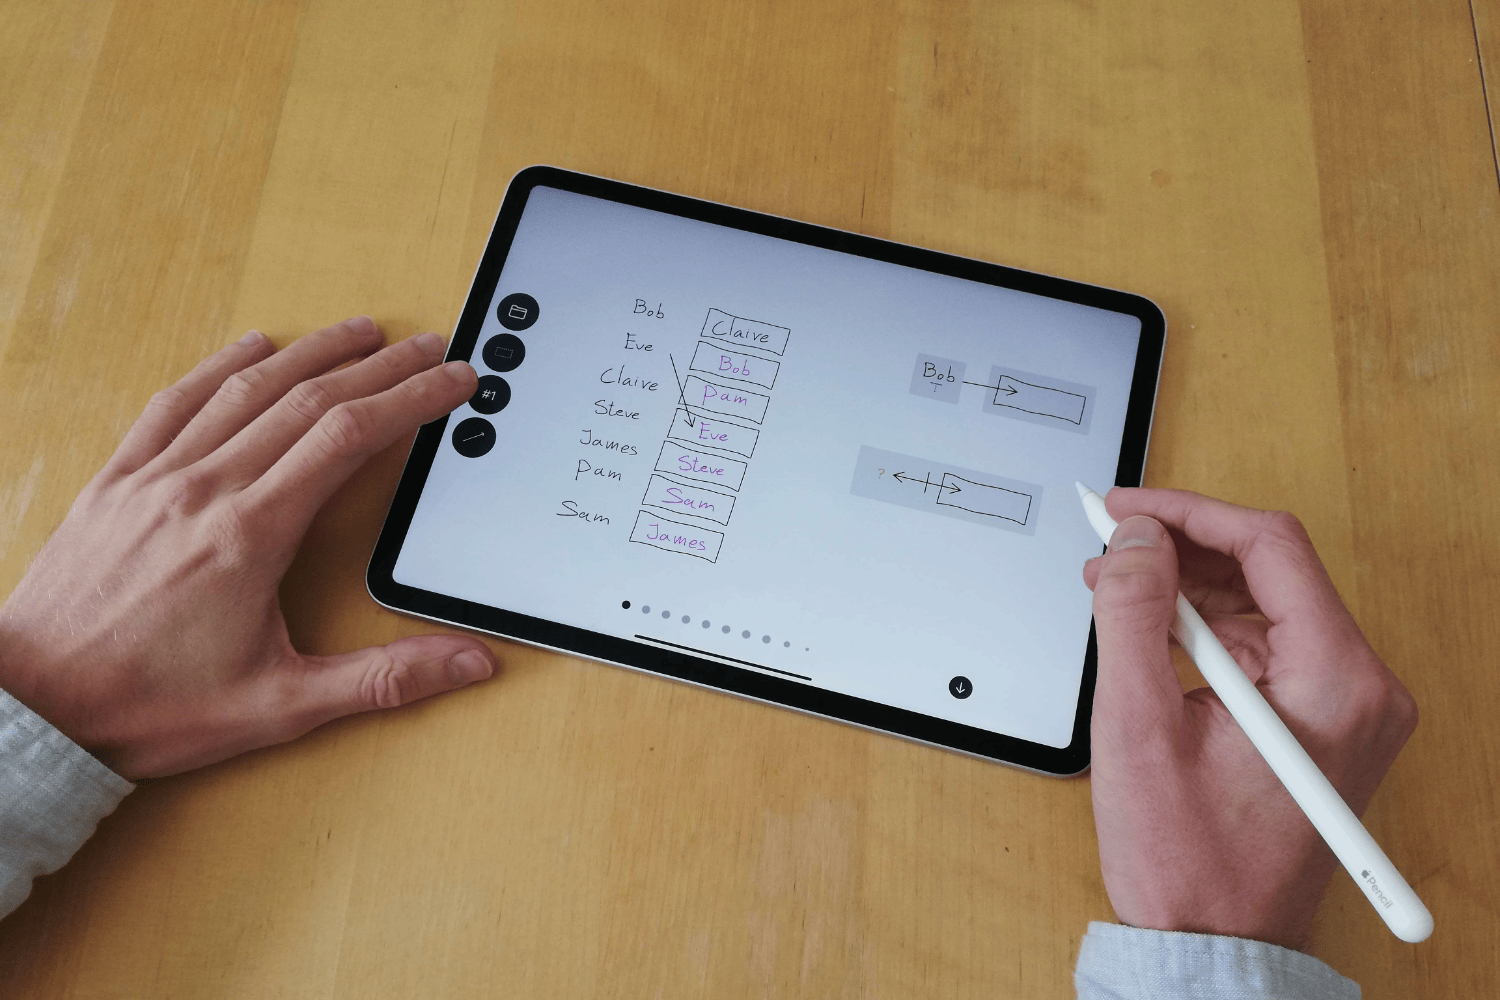
- How people visually represent discrete constraint problems
- Using linear programming (GLPK) for scheduling problems
- Tax planning with Z3 Theorem Prover
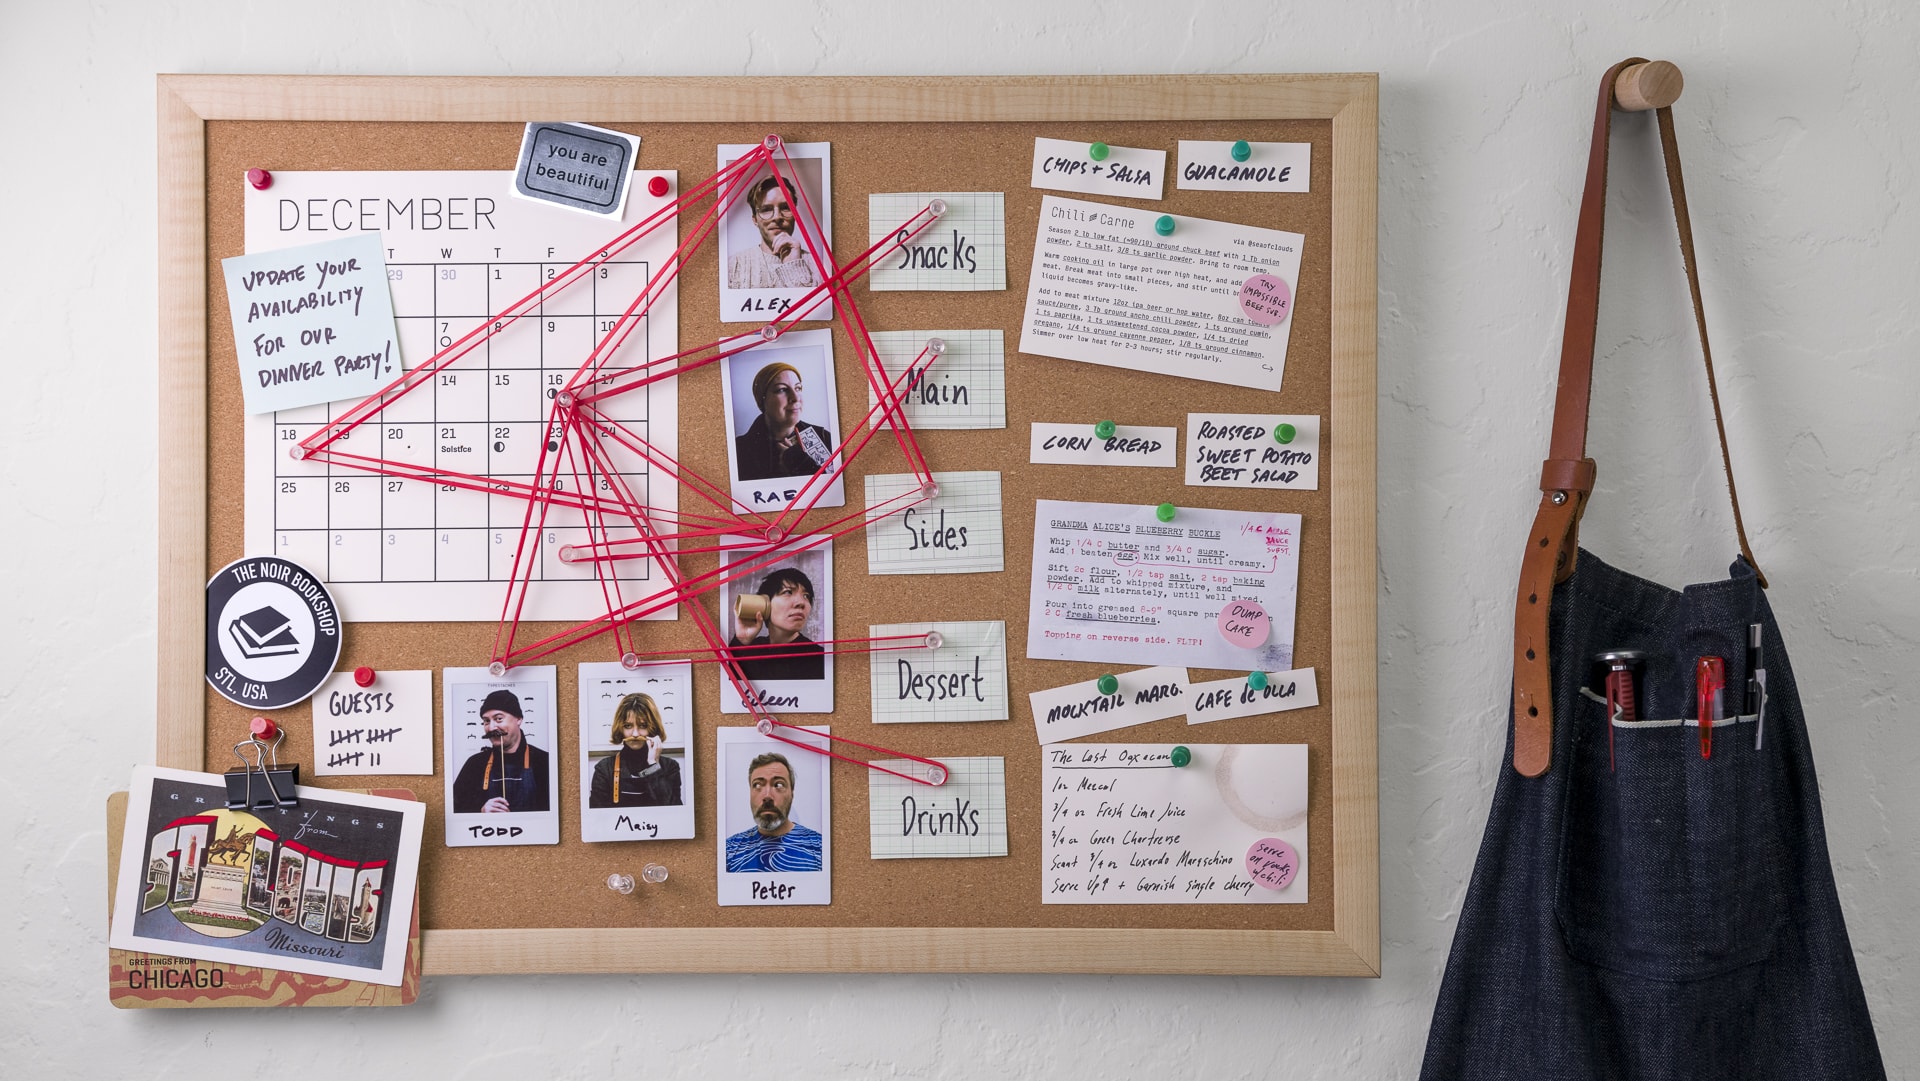
A shared pinboard becomes a collaborative modeling tool to plan a dinner party.
Untangle
We’re now going to introduce Untangle, a tool for working out real-world logic problems.
Assignment problem
To explore the basic concepts of the tool, we’re going to look at an assignment problem: imagine you’re teaching a class, it’s the end of the semester, and each student needs to submit a short paper about some topic. You want students to grade each other, so you have less work to do. Let’s see how Untangle can help us solve this problem.
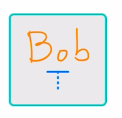
In its most basic form, Untangle allows you to automatically assign symbols to other symbols. For example, you can put Bob into a box by drawing an arrow between the text Bob and the box—Bob will now appear in pink inside the box:
Assigning Bob to a box.
We can also assign multiple symbols to a box. Untangle will now show that there are two possible assignments, by showing two dots at the bottom of the screen. We can scroll through the different solutions: Bob and Eve:
Assigning multiple students to the same box.
There are six students in our class, so we will write all of their names. Instead of drawing six arrows, we can use spatial queries to find elements on the canvas:
Using a spatial query to grab all of the student names.
Whenever we make a selection of symbols on the canvas, a popup appears. This popup suggests different spatial queries we can use to match our selection. In this case it suggests that we could look for a vertical column of symbols starting with Bob:
Representation of a spatial query capturing a column of symbols starting with Bob.
We can place this query onto the canvas, and use it as a shortcut to refer to all the symbols that match it. The matching symbols are highlighted in the same color for additional visual feedback. Untangle only ever places one symbol into each box. Whenever there are multiple ways to assign symbols, Untangle will generate multiple solutions, but display only one. The dots at the bottom of the screen indicate that there are alternative possible assignments. We can get a sense of the different solutions by scrolling through them:

Solution switcher.
We want to assign a student to every other student, so let’s create an empty box next to every name. Just like with the spatial query for a list of names, we can create a query that simply looks for all boxes. This generates all possible ways to assign one student to another one:
Using the all boxes query to assign every student to another student.
Currently, students are sometimes assigned to grade themselves. While students will surely be happy to do so, as a teacher, I would rather avoid this situation.
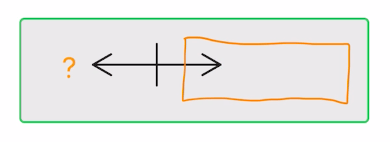
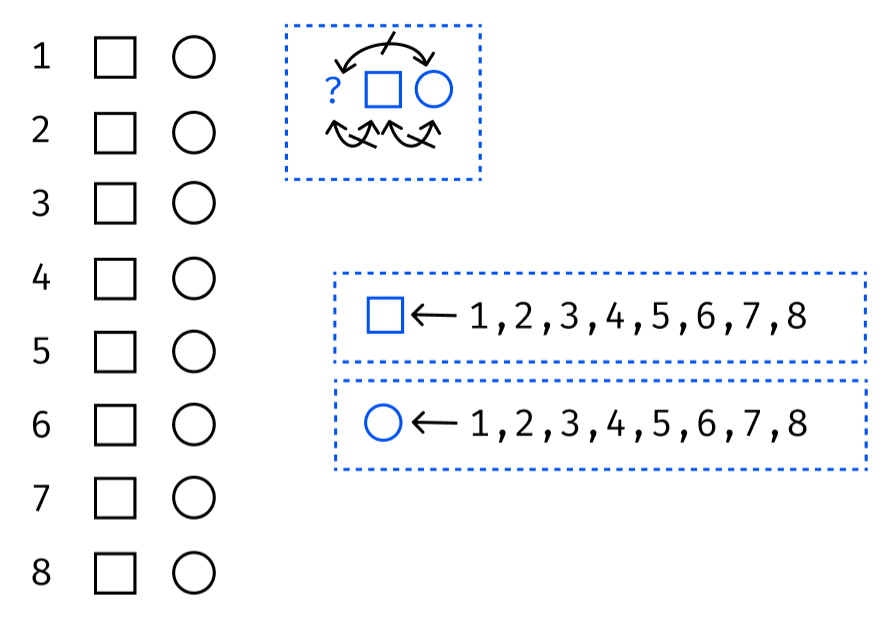
Let’s add a rule that prevents students from grading themselves. To do this, we’ll add a third spatial query. This query matches any box that has something to the left of it. The ? question mark acts as a wildcard, matching any symbol:
Using ? wildcard to capture something next to a box, and make that something not equal to the contents of the box.
Finally, we can draw an inequality constraint arrow. This expresses that whatever ends up in the box, cannot be the same as whatever symbol is on its left. Bob can no longer grade Bob:
Inequality constraint.
Let’s say we omitted a student when writing the original list of names. Because we’re using spatial queries to describe the column of student names, we can easily extend the list:
Extending the student list with a new name. The results update reactively.
It turns out that Bob and Claire have written papers about similar topics. So, it would be great if they grade each other. We can ensure this by simply putting their names into the corresponding boxes, and the system will adapt accordingly:
Forcing the assignment of Bob to Claire. Again, the system reacts with new results.
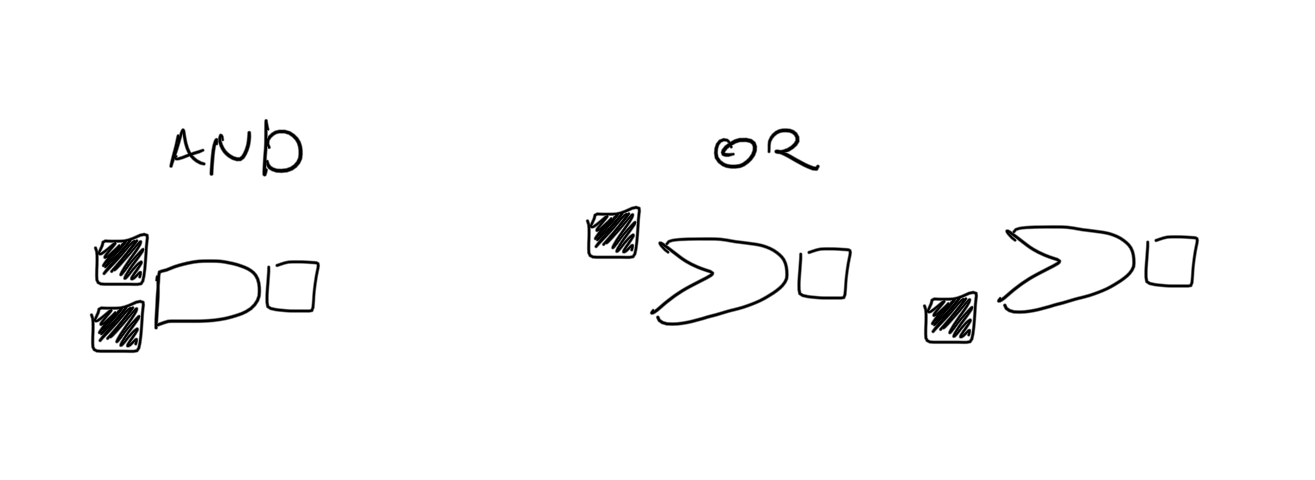
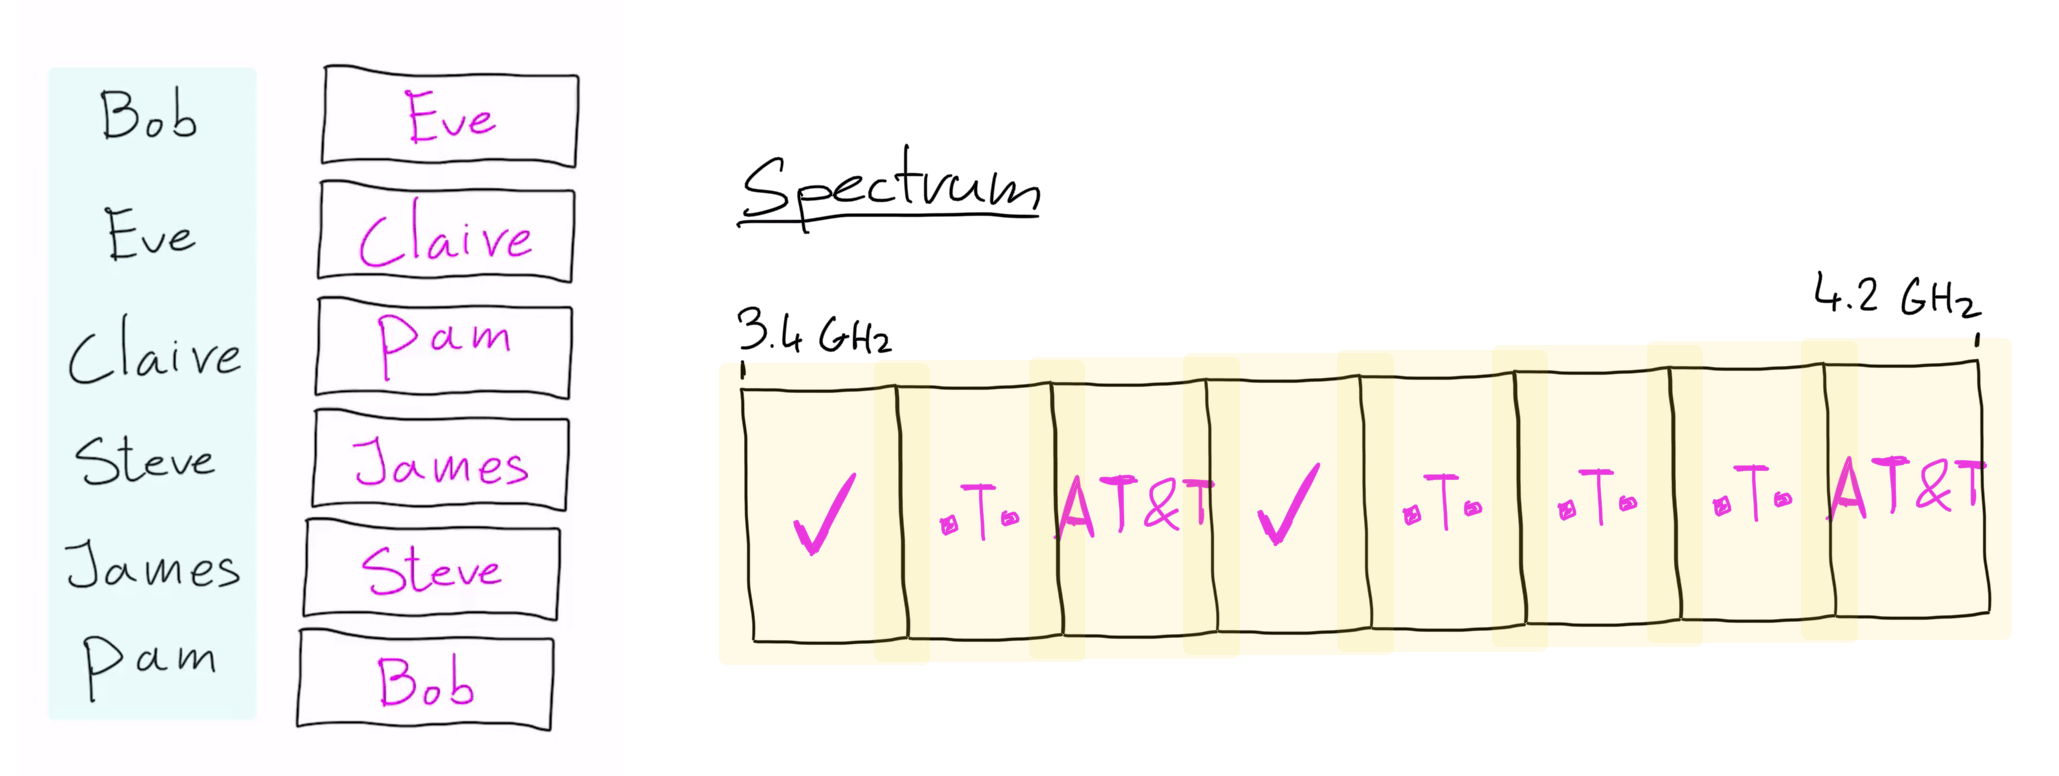
Frequency assignment bids
To show a few more interesting properties of Untangle, let’s look at a different example—running frequency spectrum assignment bids. The basic idea is that a specific radio frequency spectrum, say 5G, is divided into smaller parts, and sold to various operators.
Let’s start by modeling this problem. There are three telephone companies (telcos) that are bidding on the frequency spectrum from 3.4 GHz to 4.2 GHz. The spectrum is split into eight bands, and the telcos can bid on individual bands:
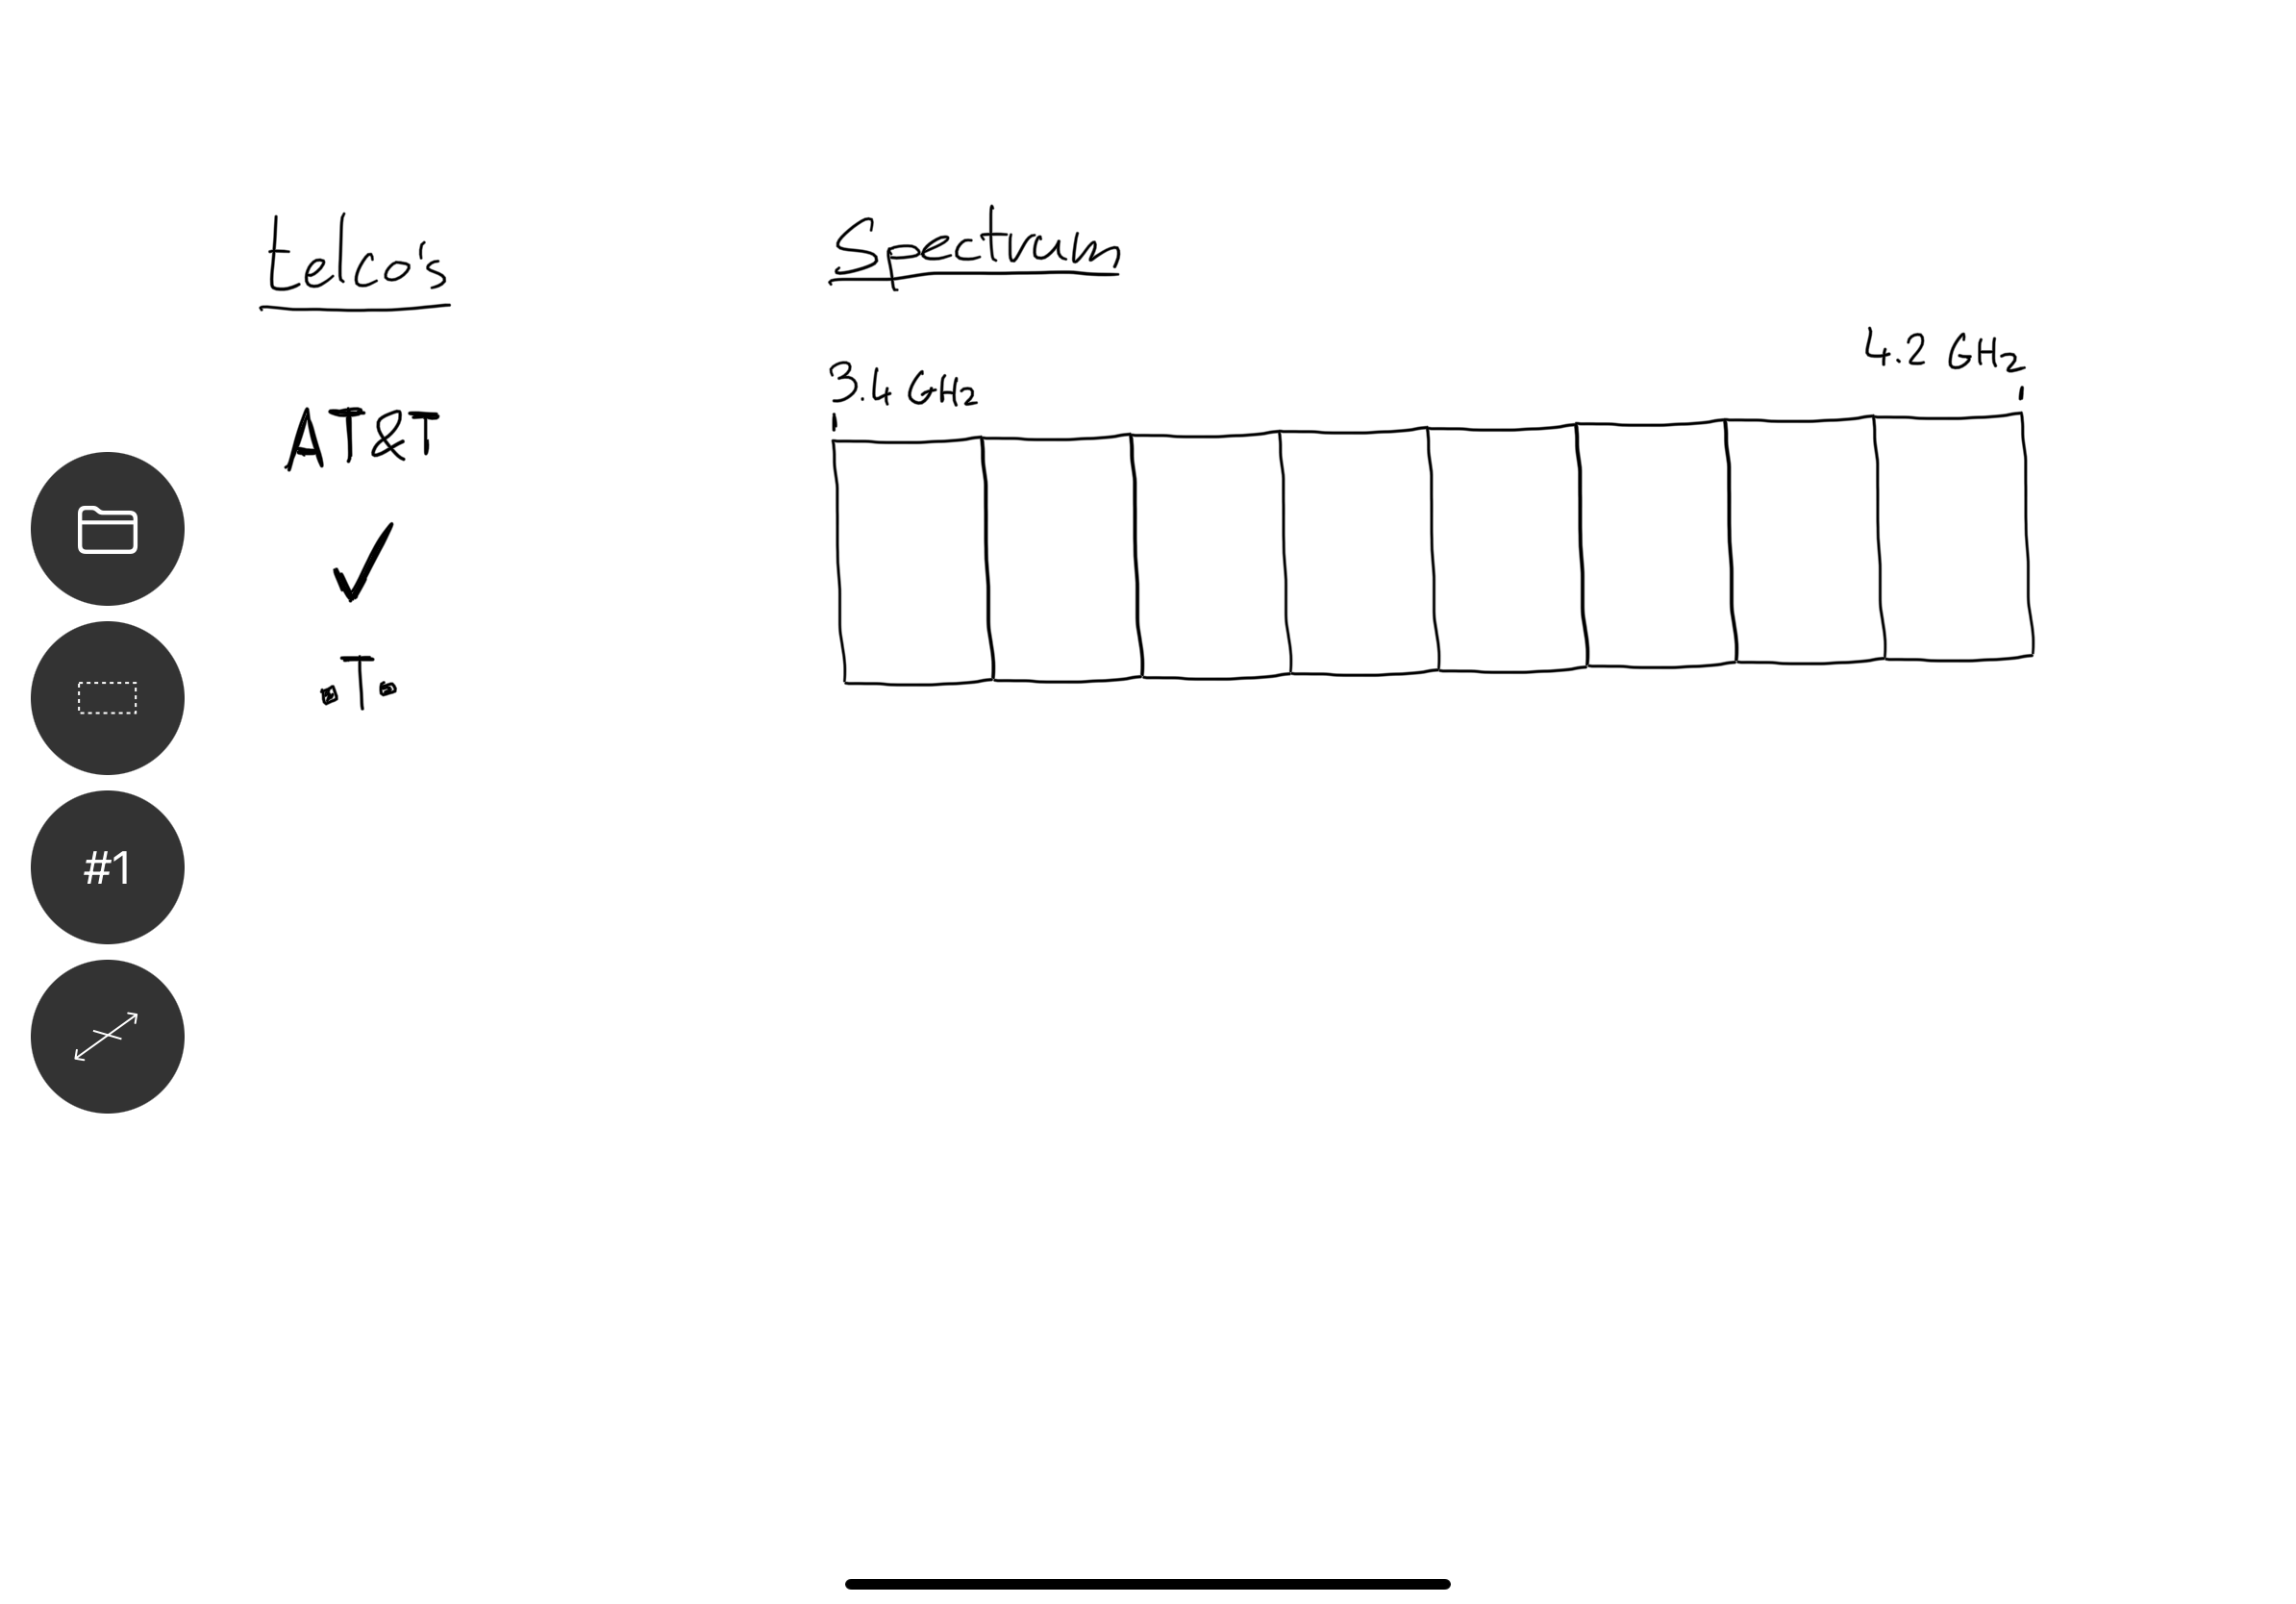
Initial model of the spectrum assignment problem.
Just as in the student grading example, we could use spatial queries to assign telcos randomly to bands in the spectrum:
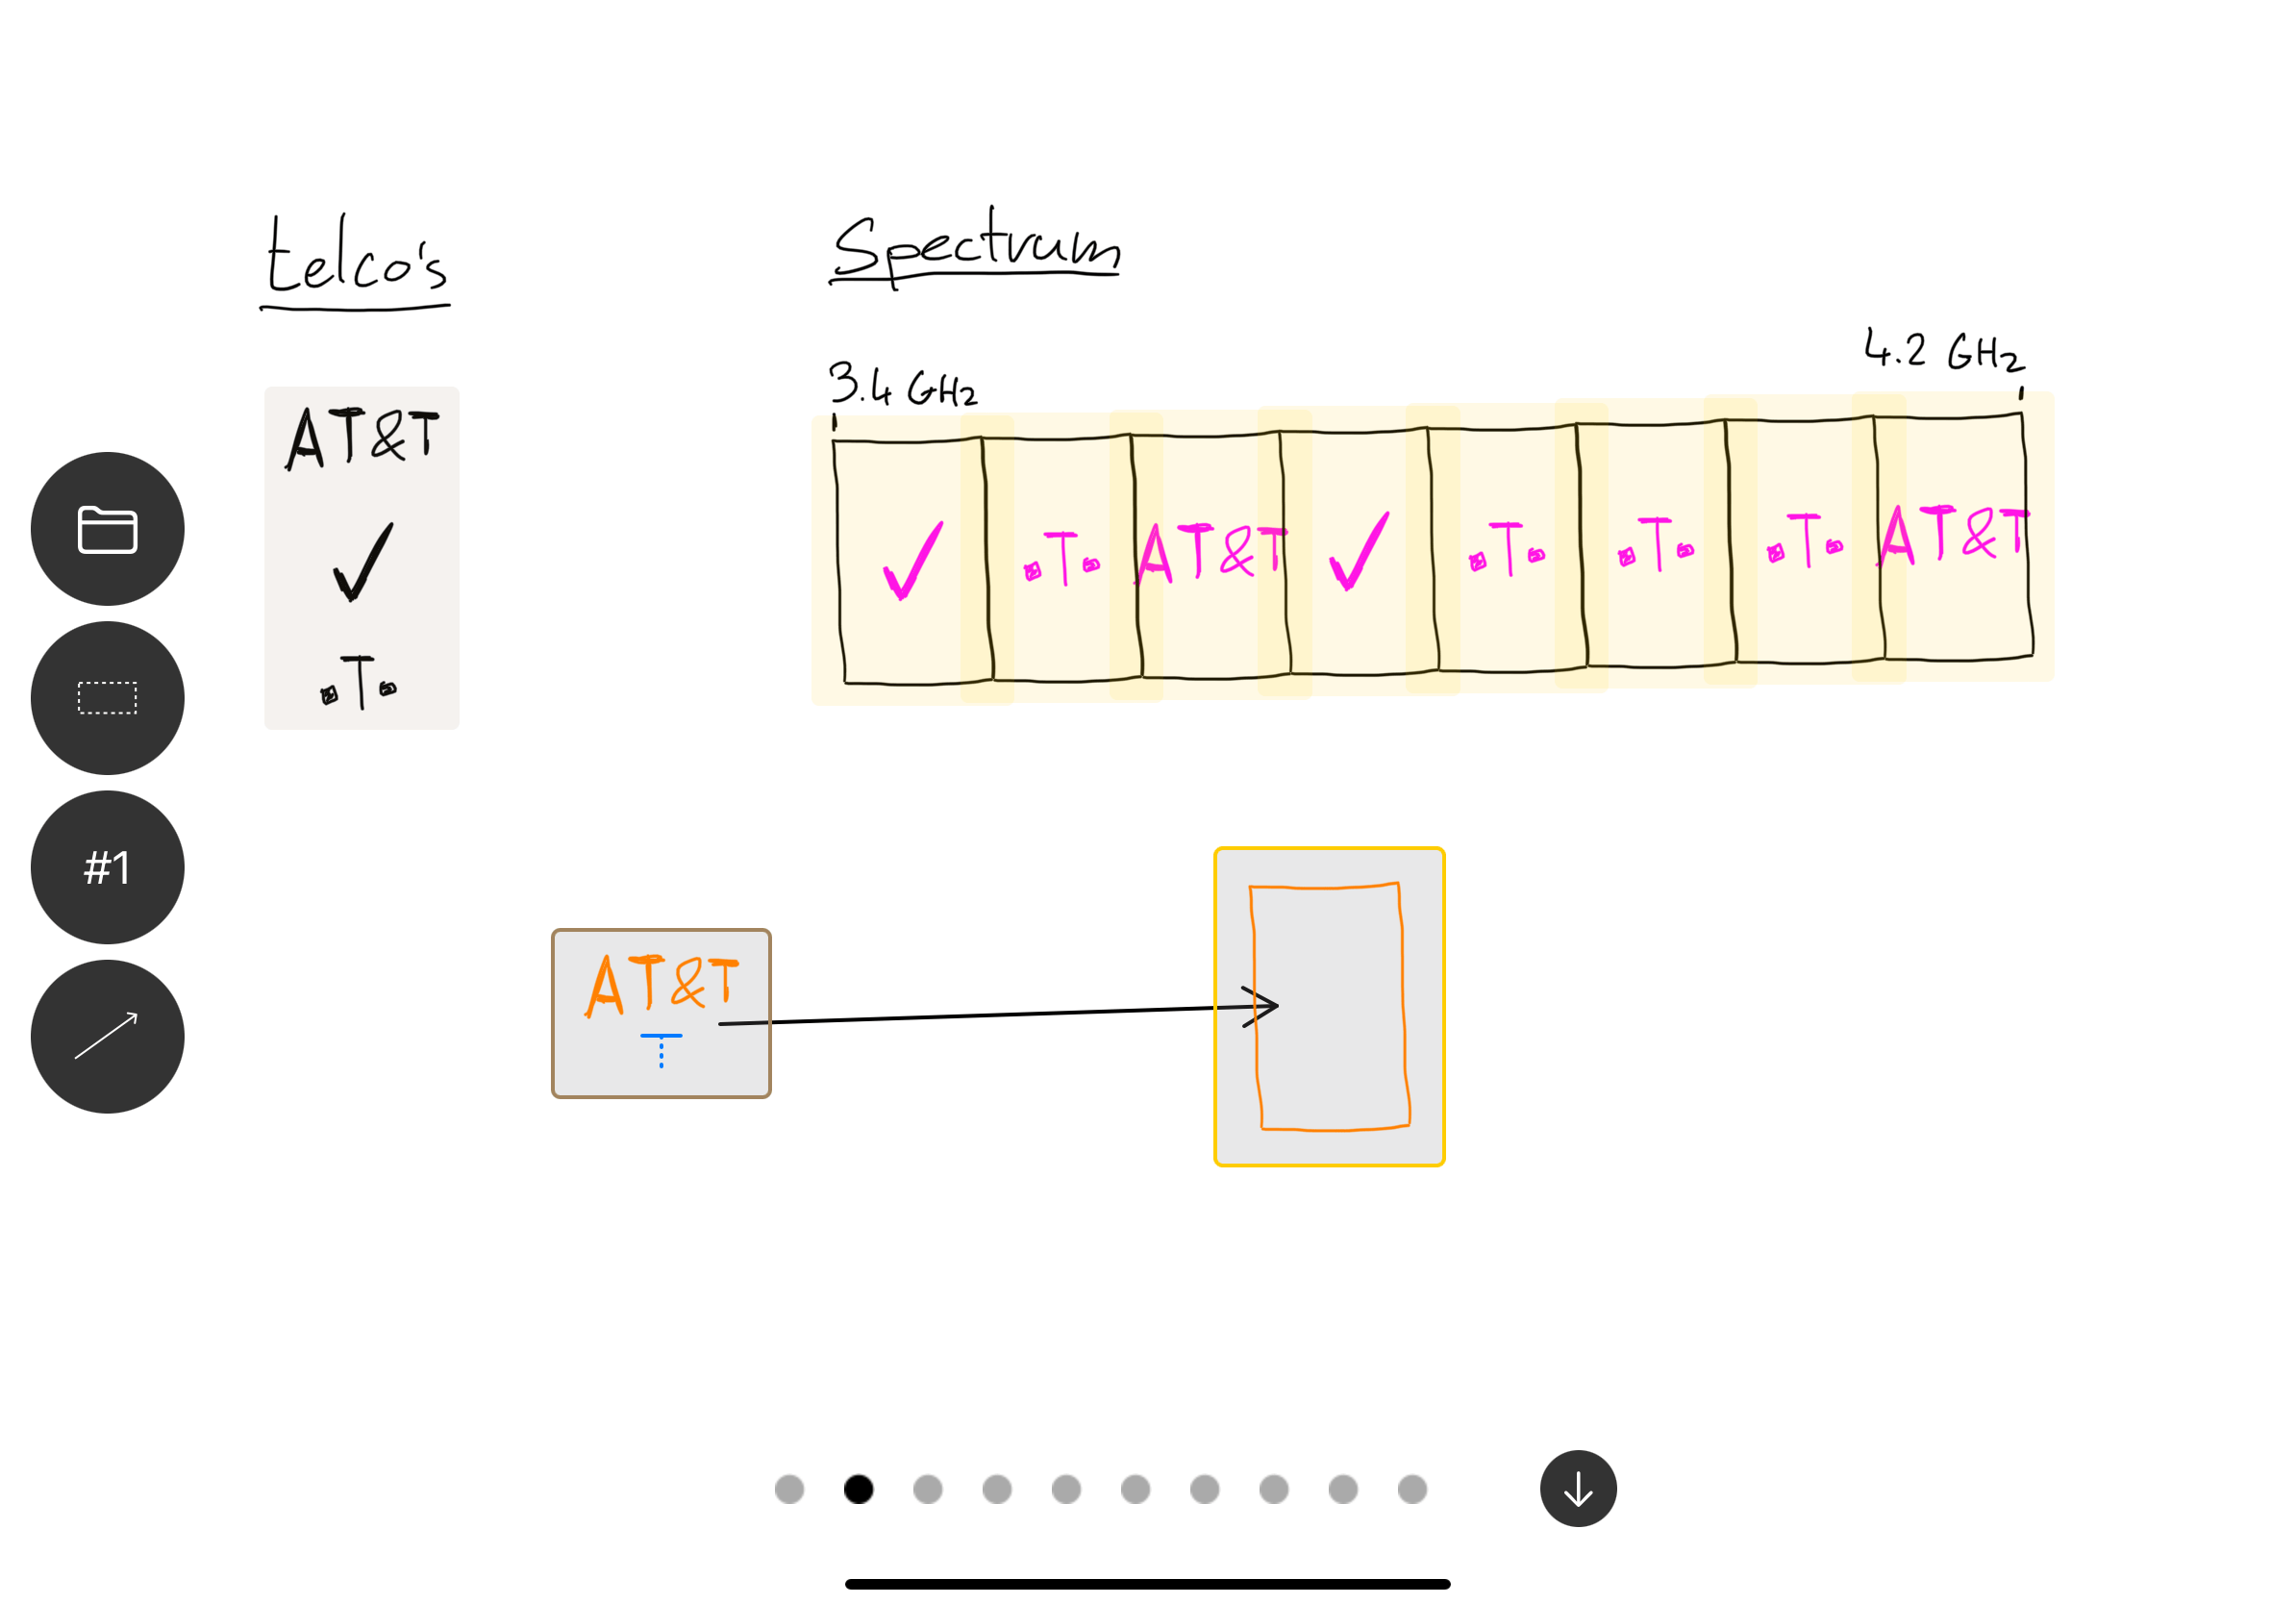
Assigning operators to random bands of the available spectrum.
But this is not really how an auction works. Instead, telcos bid on a specific number of bands that they want to obtain. For example, Verizon might place a bid for four bands. We can model this using a count modifier, which limits the number of times a certain rule applies:
Using a count modifier to limit the assignment to four times.
Let’s rearrange the canvas a bit, and add some imaginary bids for each of the companies:
Modeling bids from all of the operators.
Some bands can be more valuable (for example the middle bands often have less interference), so a company may bit not just on a specific number of bands, but also specific placement inside the spectrum. To model this, we can either draw an arrow directly to the specified band, or simply drag a symbol in place. We can guide the solver into a direction that we care about, and it will respond immediately:
Constraining the solution-space further by modeling bids on specific bands in the available spectrum.
The number of bids might not equal the number of available slots—an over-constrained system. Using most solvers, the result would be an error message that the constraints are unsatisfiable. Instead of showing an error, Untangle will attempt to generate a partially correct solution by ignoring some of the rules. Arrows will turn red, indicating that for the currently shown solution, this rule is ignored:
Relaxing the over-constrained problem representation by ignoring some of the rules.
When having a conversation with the material, hearing “no, but what if…” is more encouraging than hearing just “no.” The machine doesn’t brake or scold at you for making a mistake, but instead shows compromises and possible directions, which in turn helps generate new ideas.
Finally, companies sometimes bid specifically on a set of consecutive bands—rather than just bidding on four bands, they want four bands in a row. We can model this using a combination of spatial queries and counts:
Creating an assignment rule of four consecutive bands using a combination of spatial queries and count modifiers.
Coffee shop schedule
In the following example, we’ll show how to create a work schedule for a coffee shop. An easy solution is to assign employees to random days, but to make a good schedule everyone is happy with, we need to consider employee availability.
To solve this problem, we need to two dimensions. First we list availability of the employees in the top-left corner. For each day that an employee is available, we draw an X. For example, Jim is available on Monday, Wednesday and Friday. In the bottom right, we draw a simple empty schedule for the week:
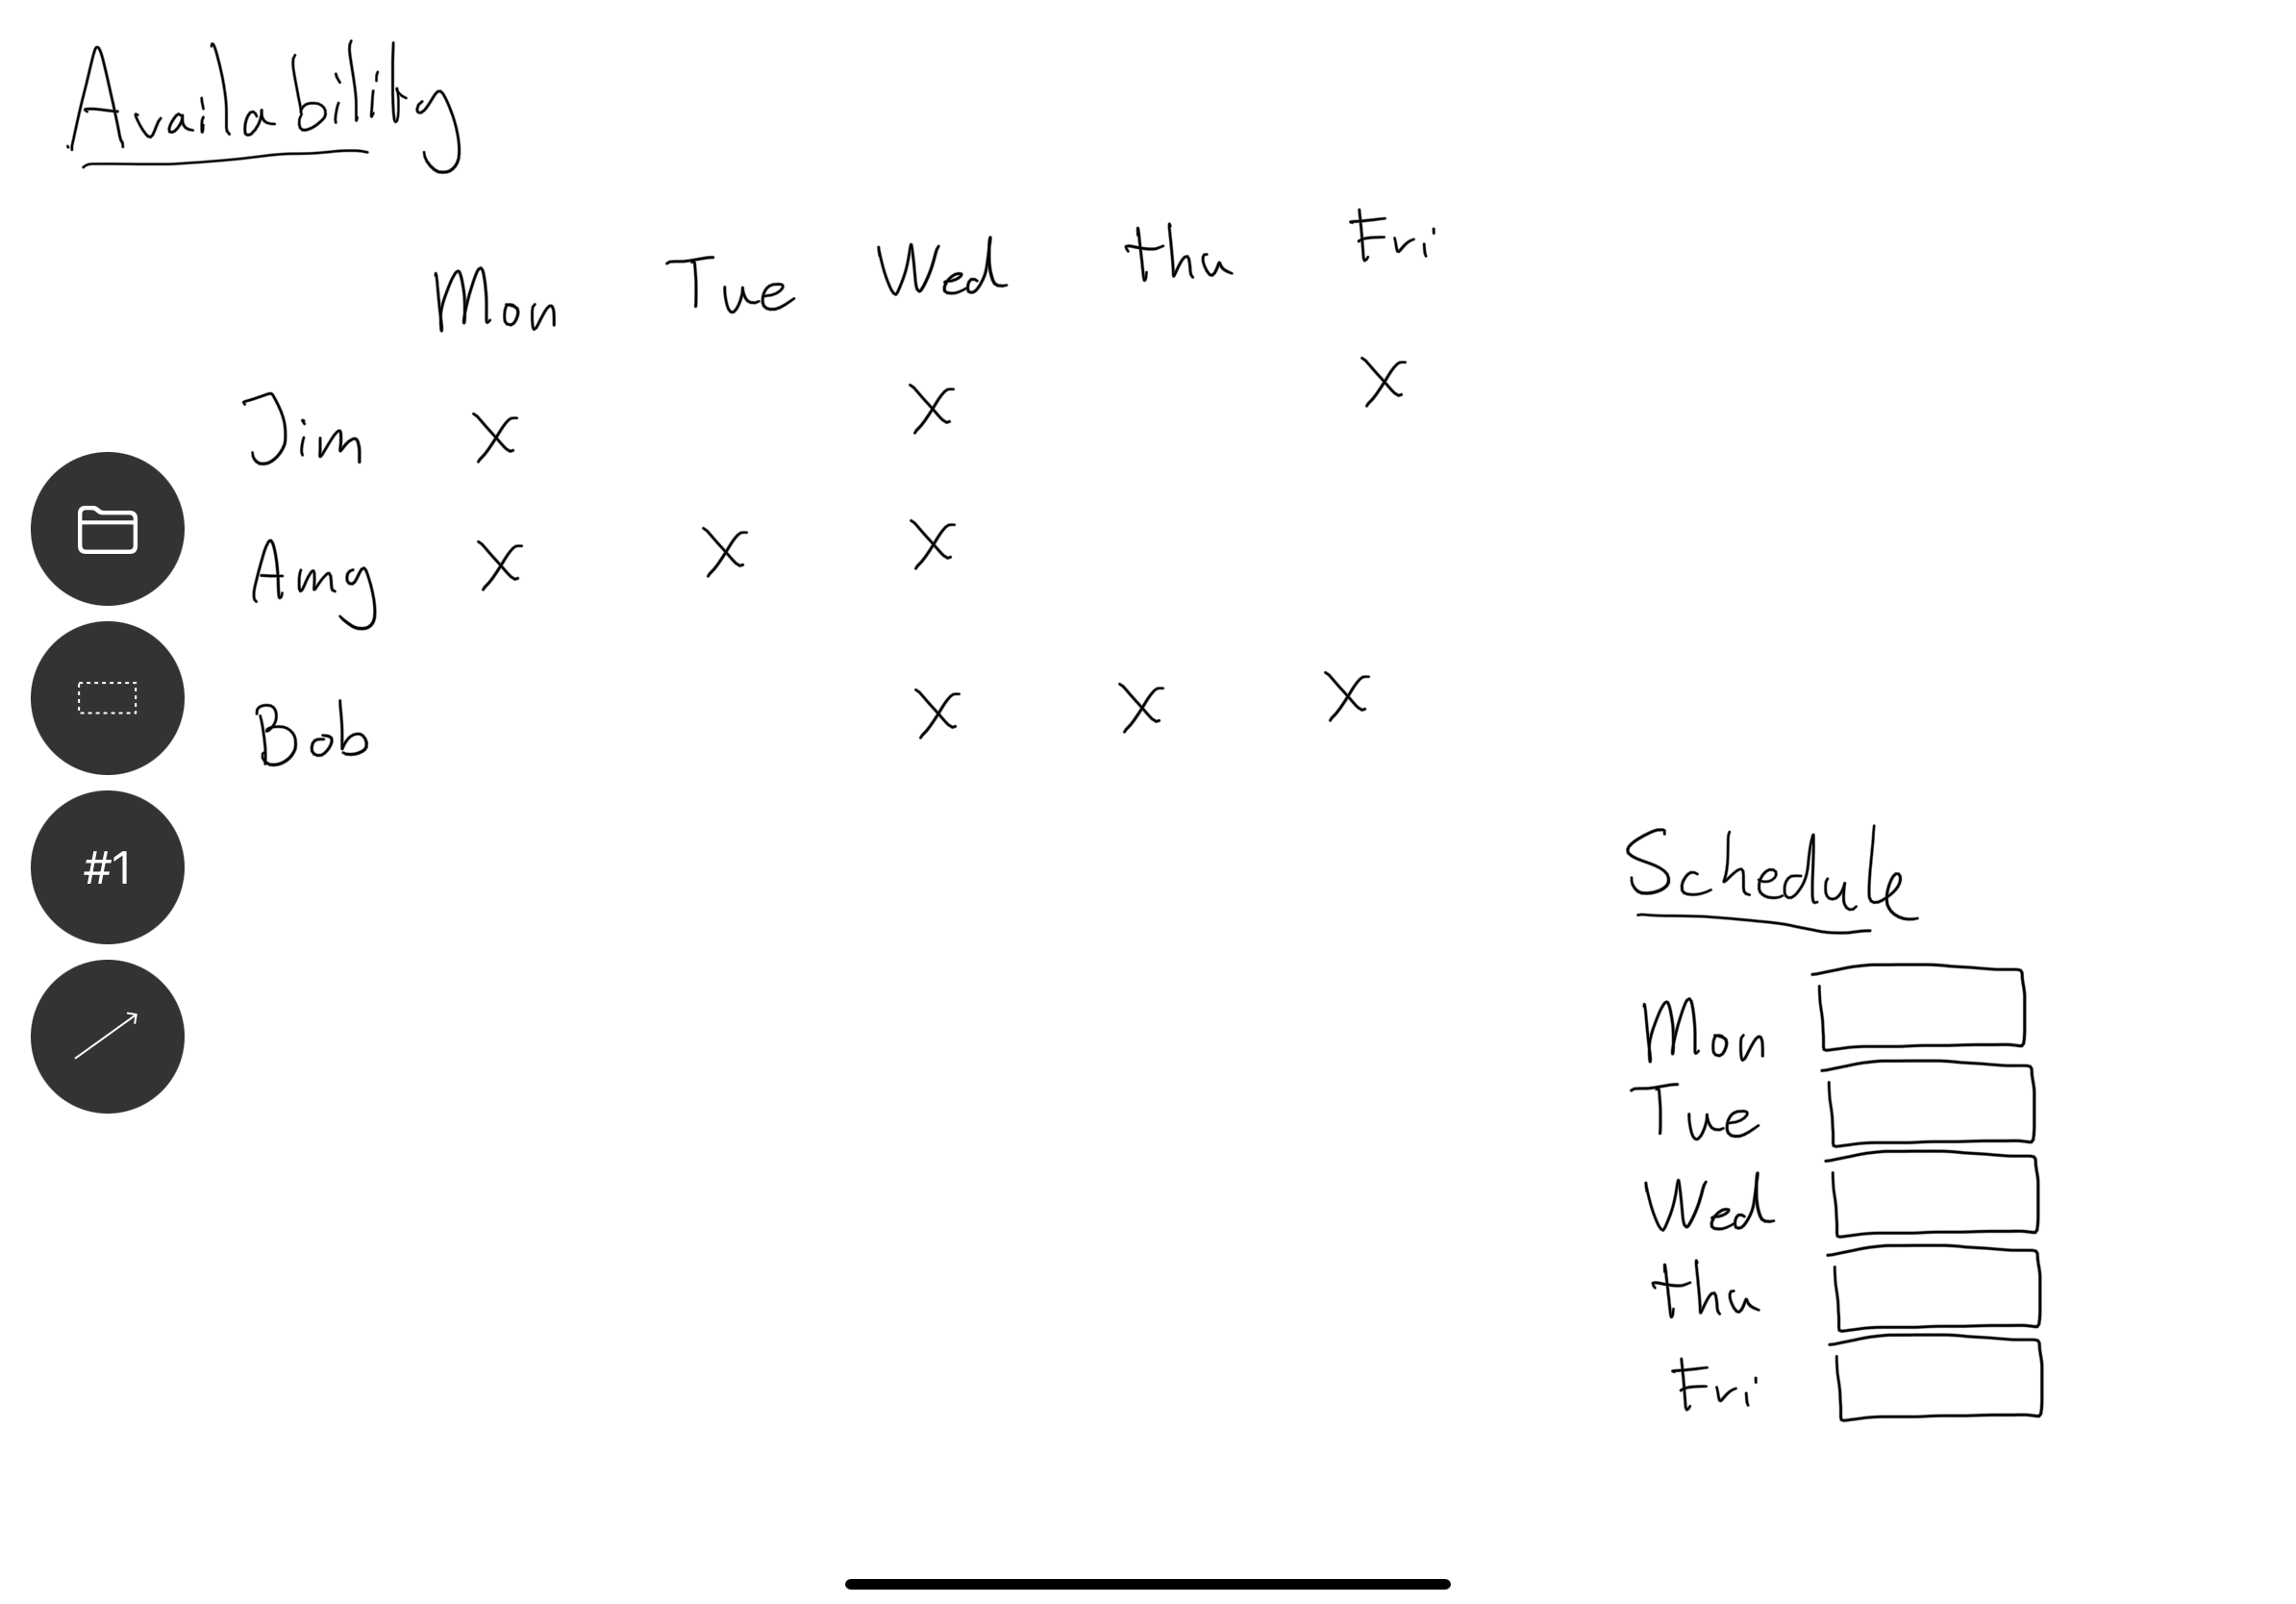
Modeling the baristas availability.
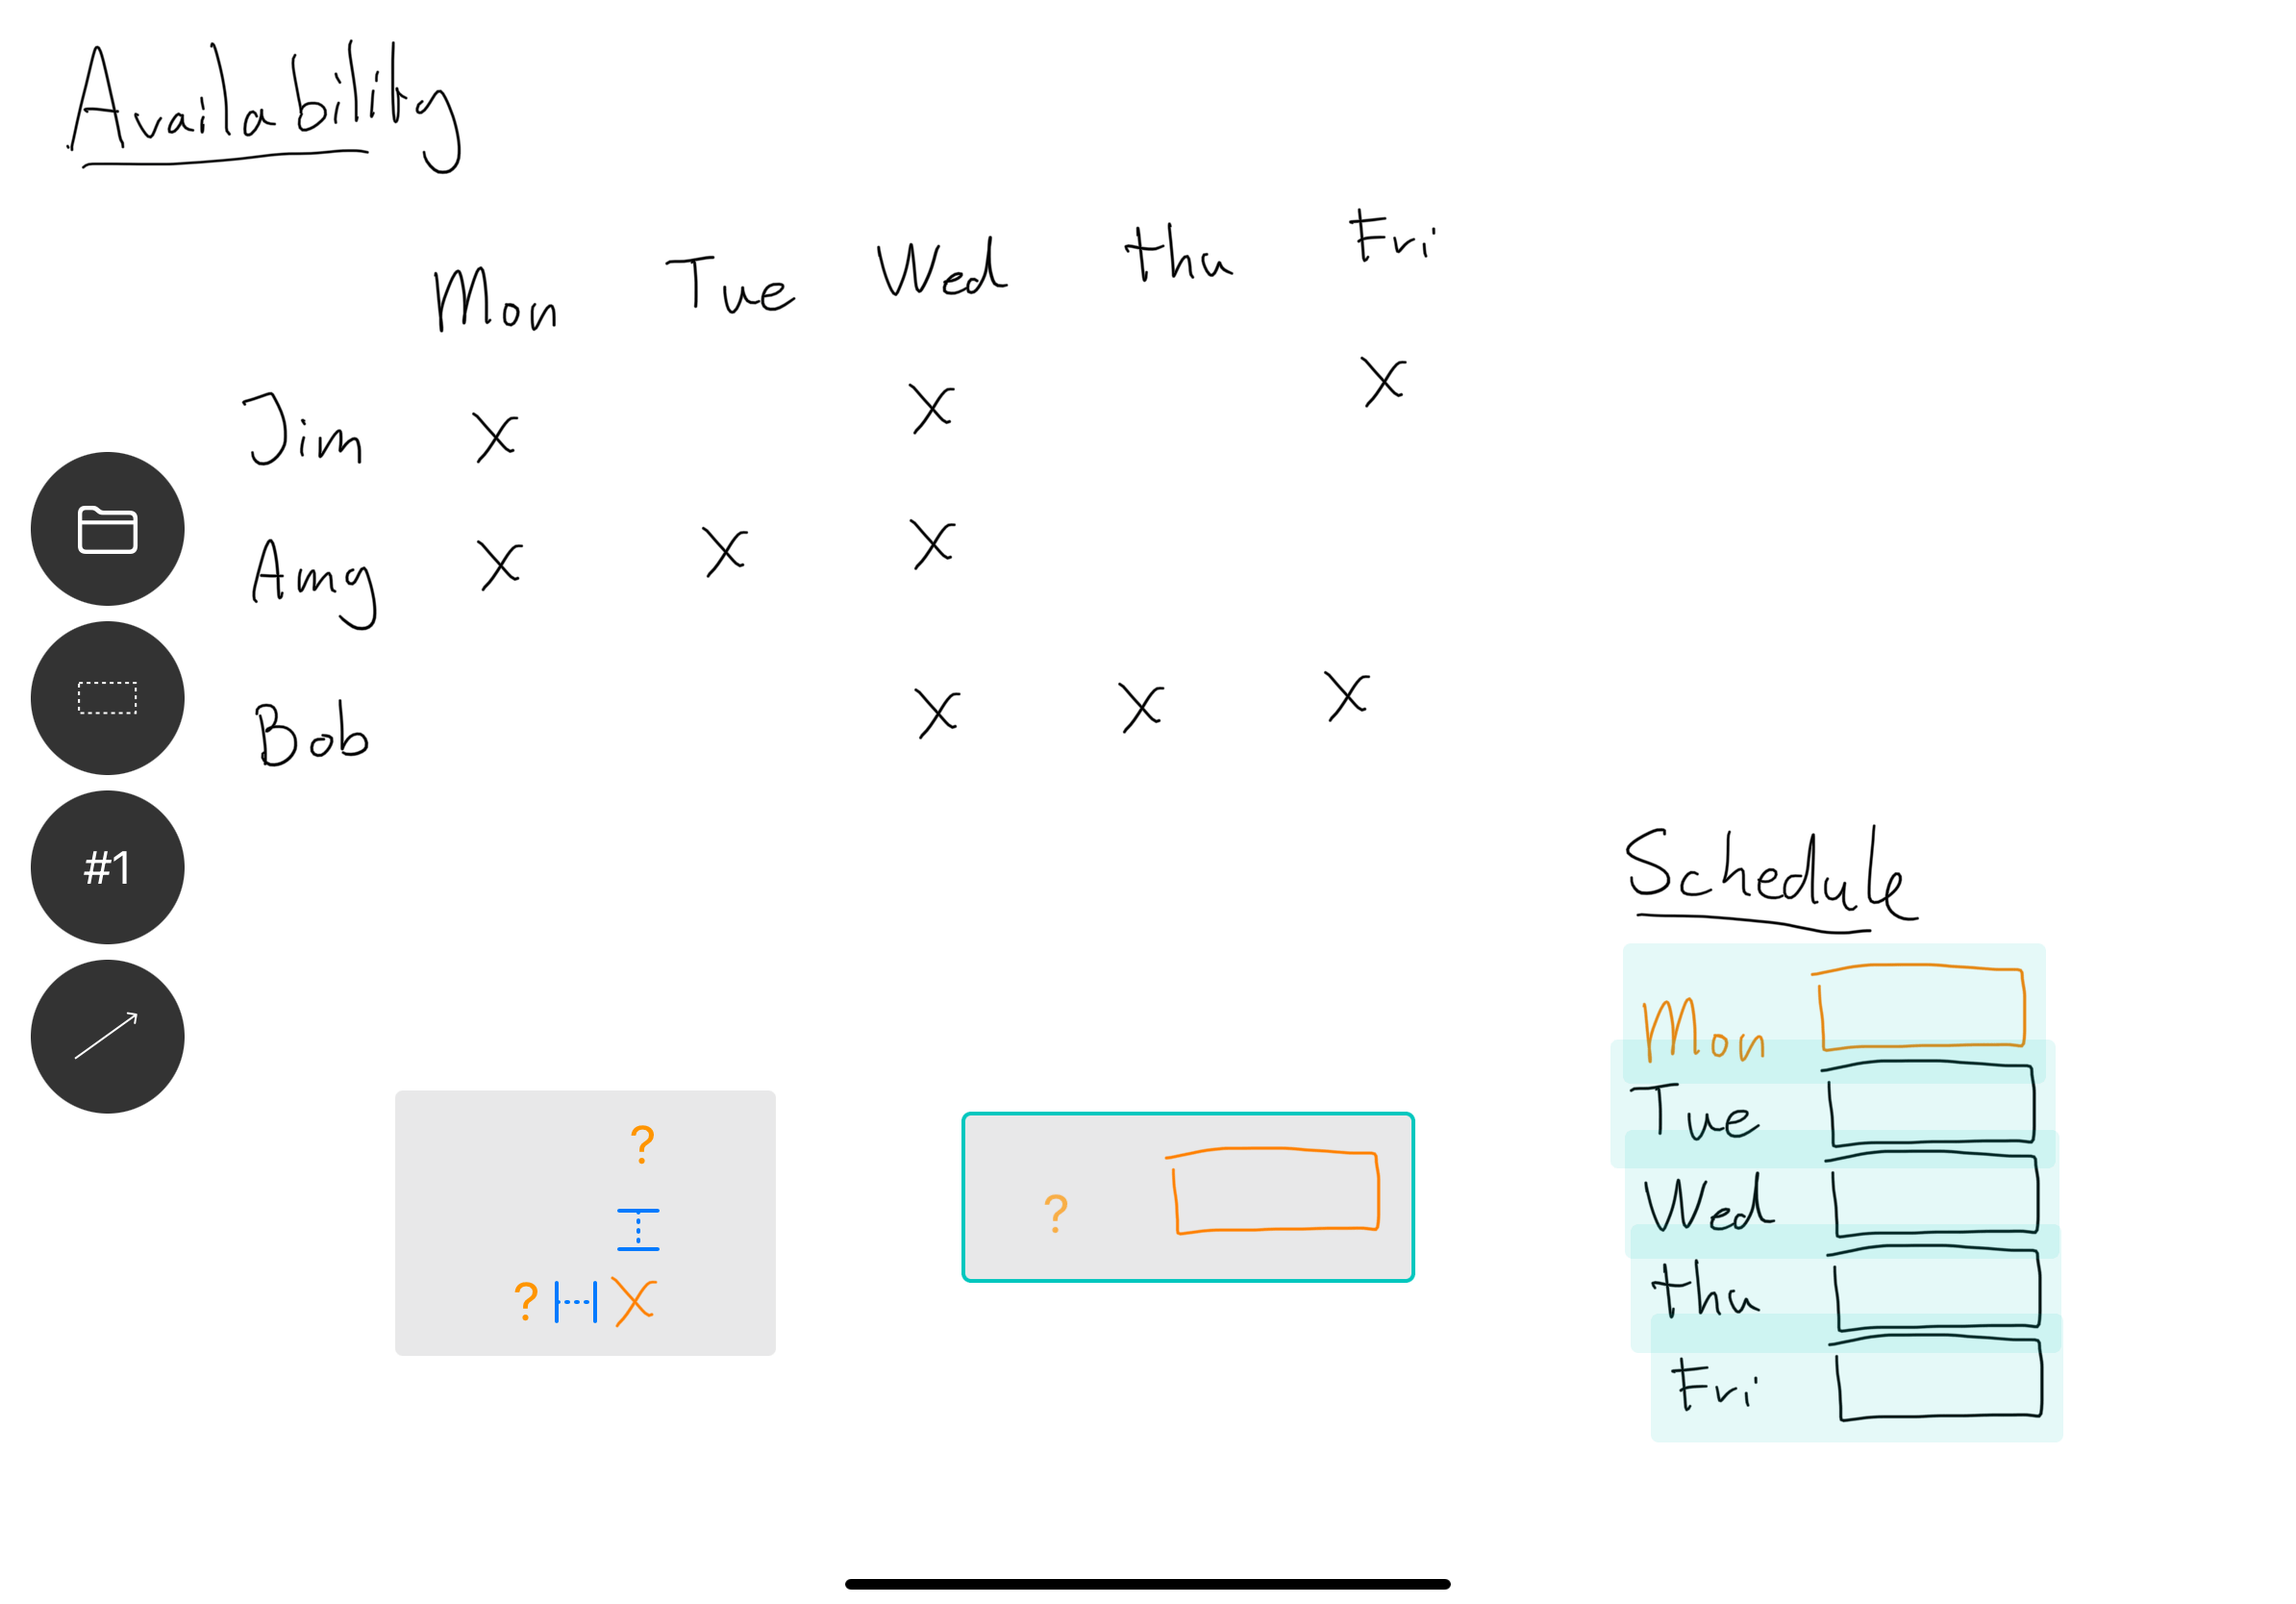
Untangle has a special lookup spatial query that allows us to look up information in table-like layouts. In this case, it matches column/row pairs together whenever it finds an X:
Using the lookup spatial query on the availability table.
You can think of this as finding all the available people for each day. Untangle will only generate solutions where the day and name are matched in the availability table:
Visualization of running the lookup spatial query.
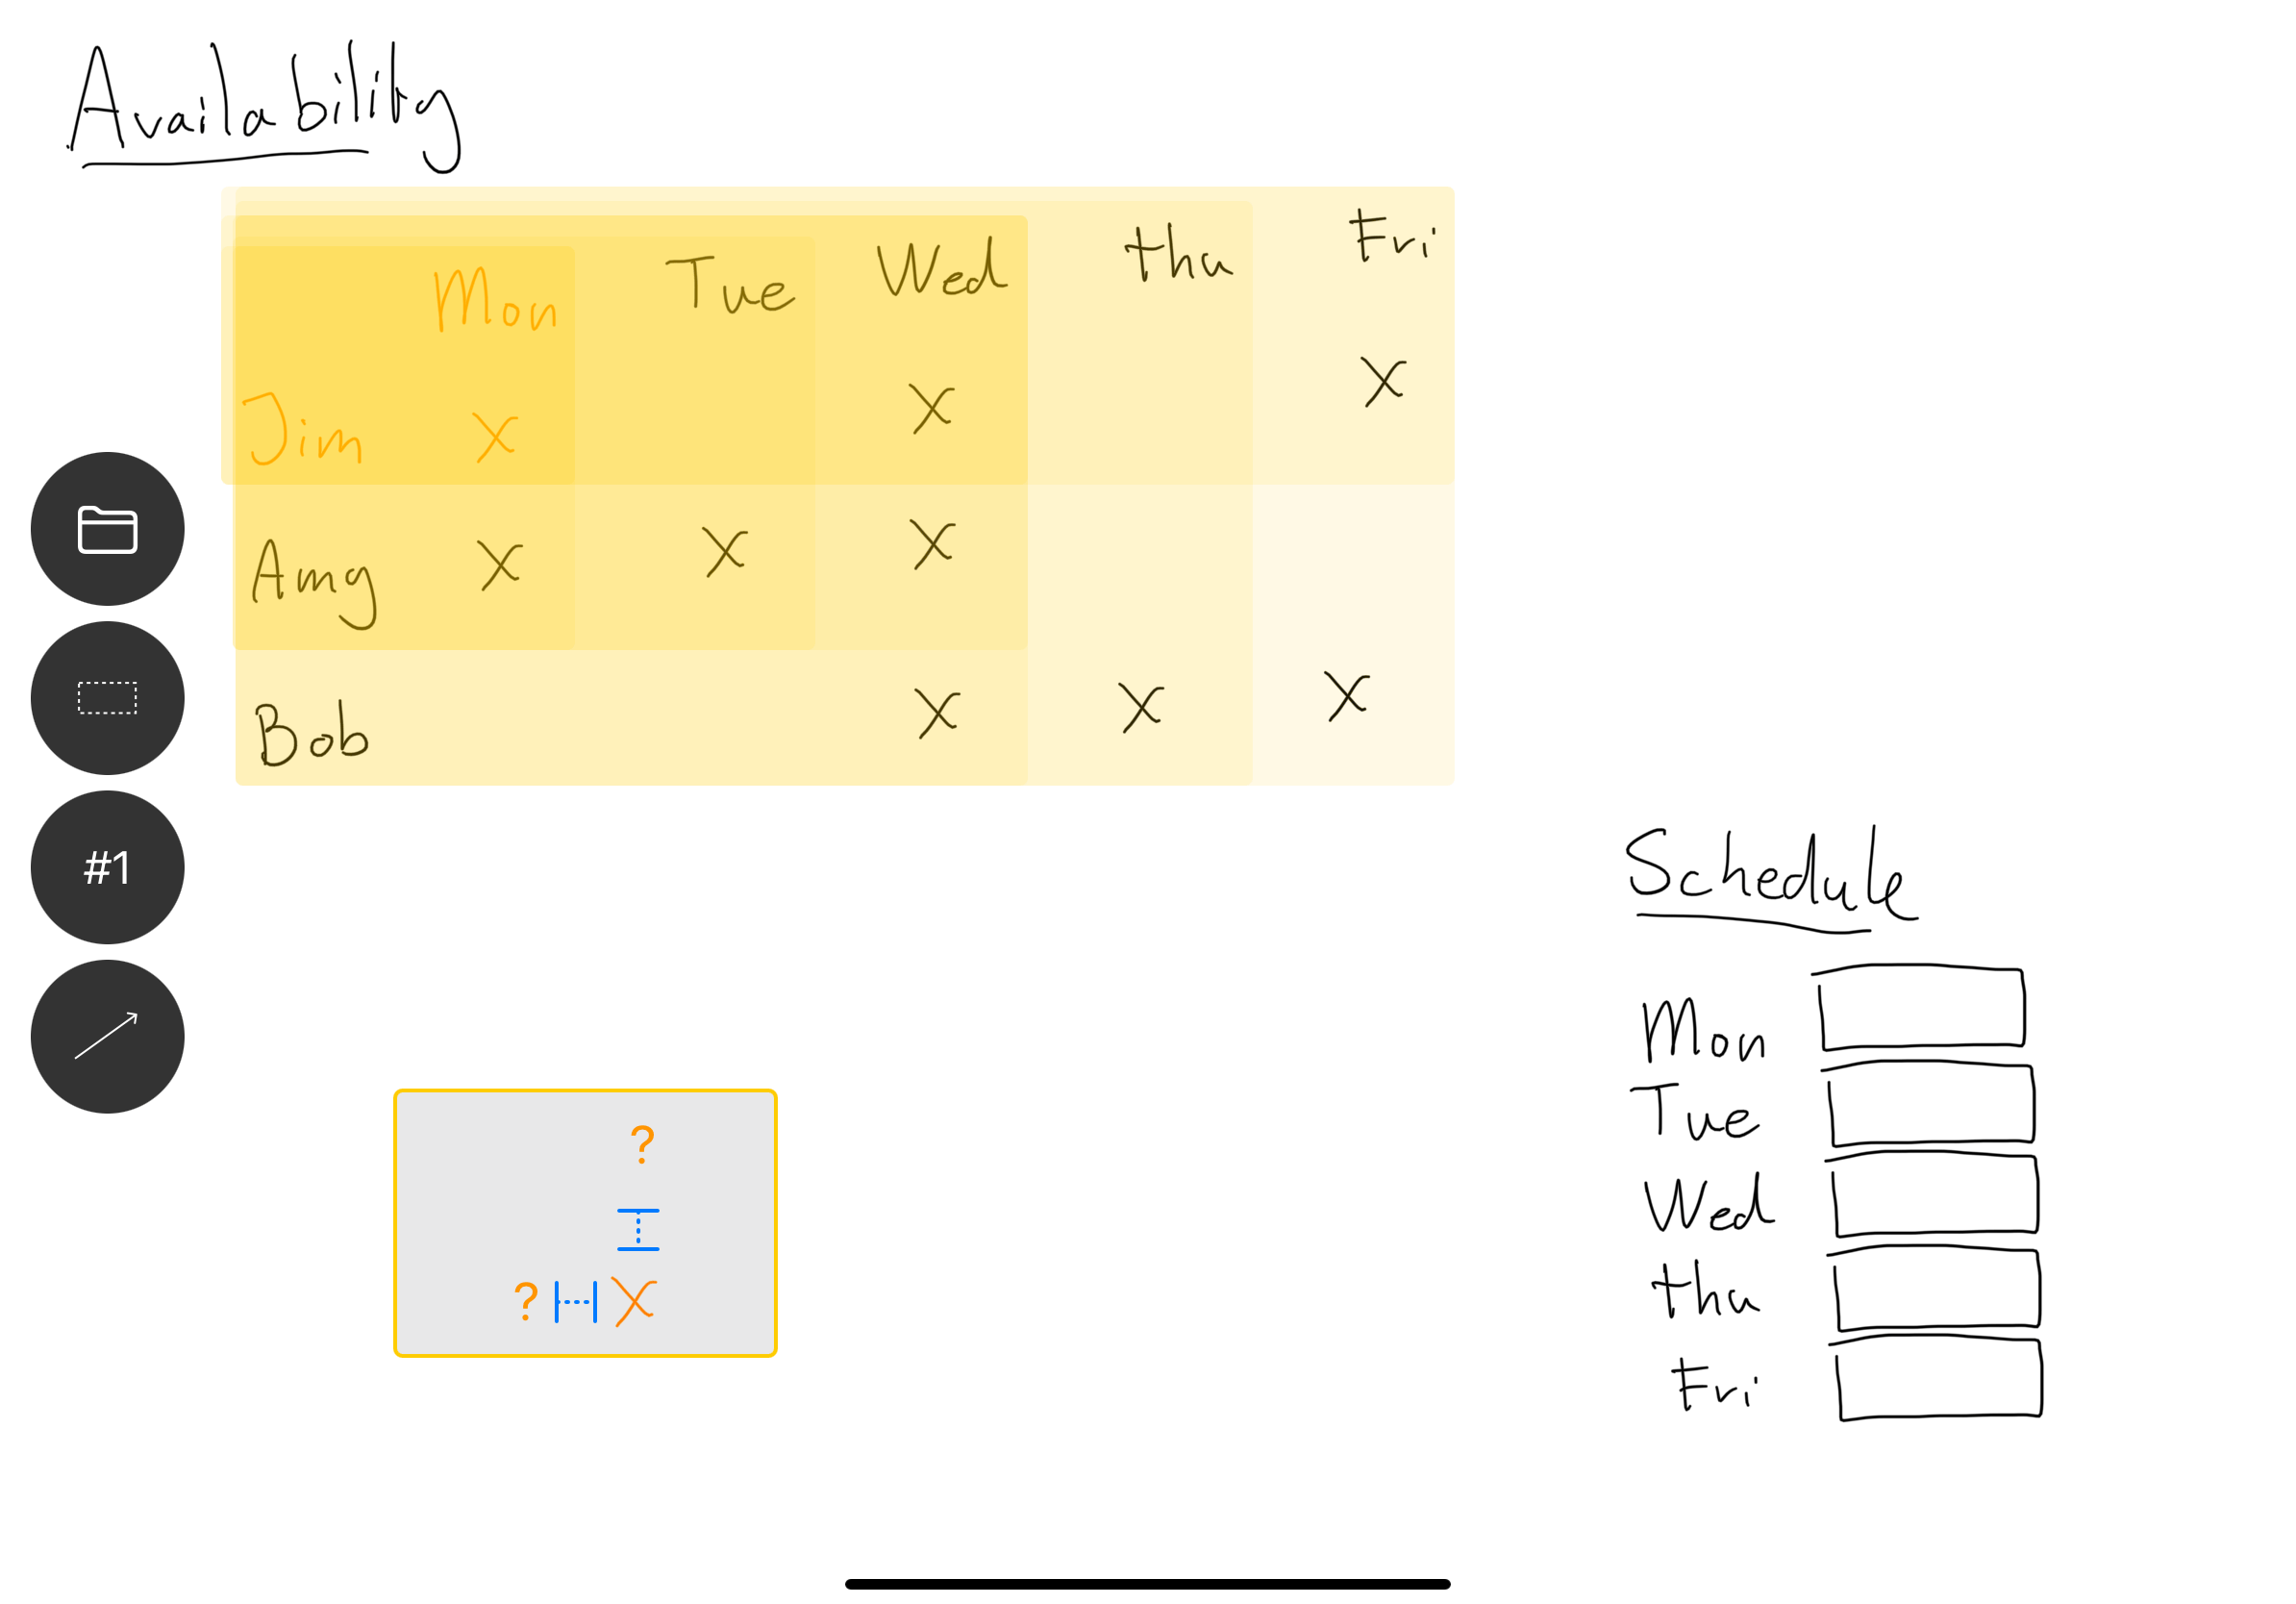
We then create a spatial query to find all of the empty slots in the schedule, using a something on left, box on right query:
Spatial query using a ? wildcard symbol and a box to the right of it.
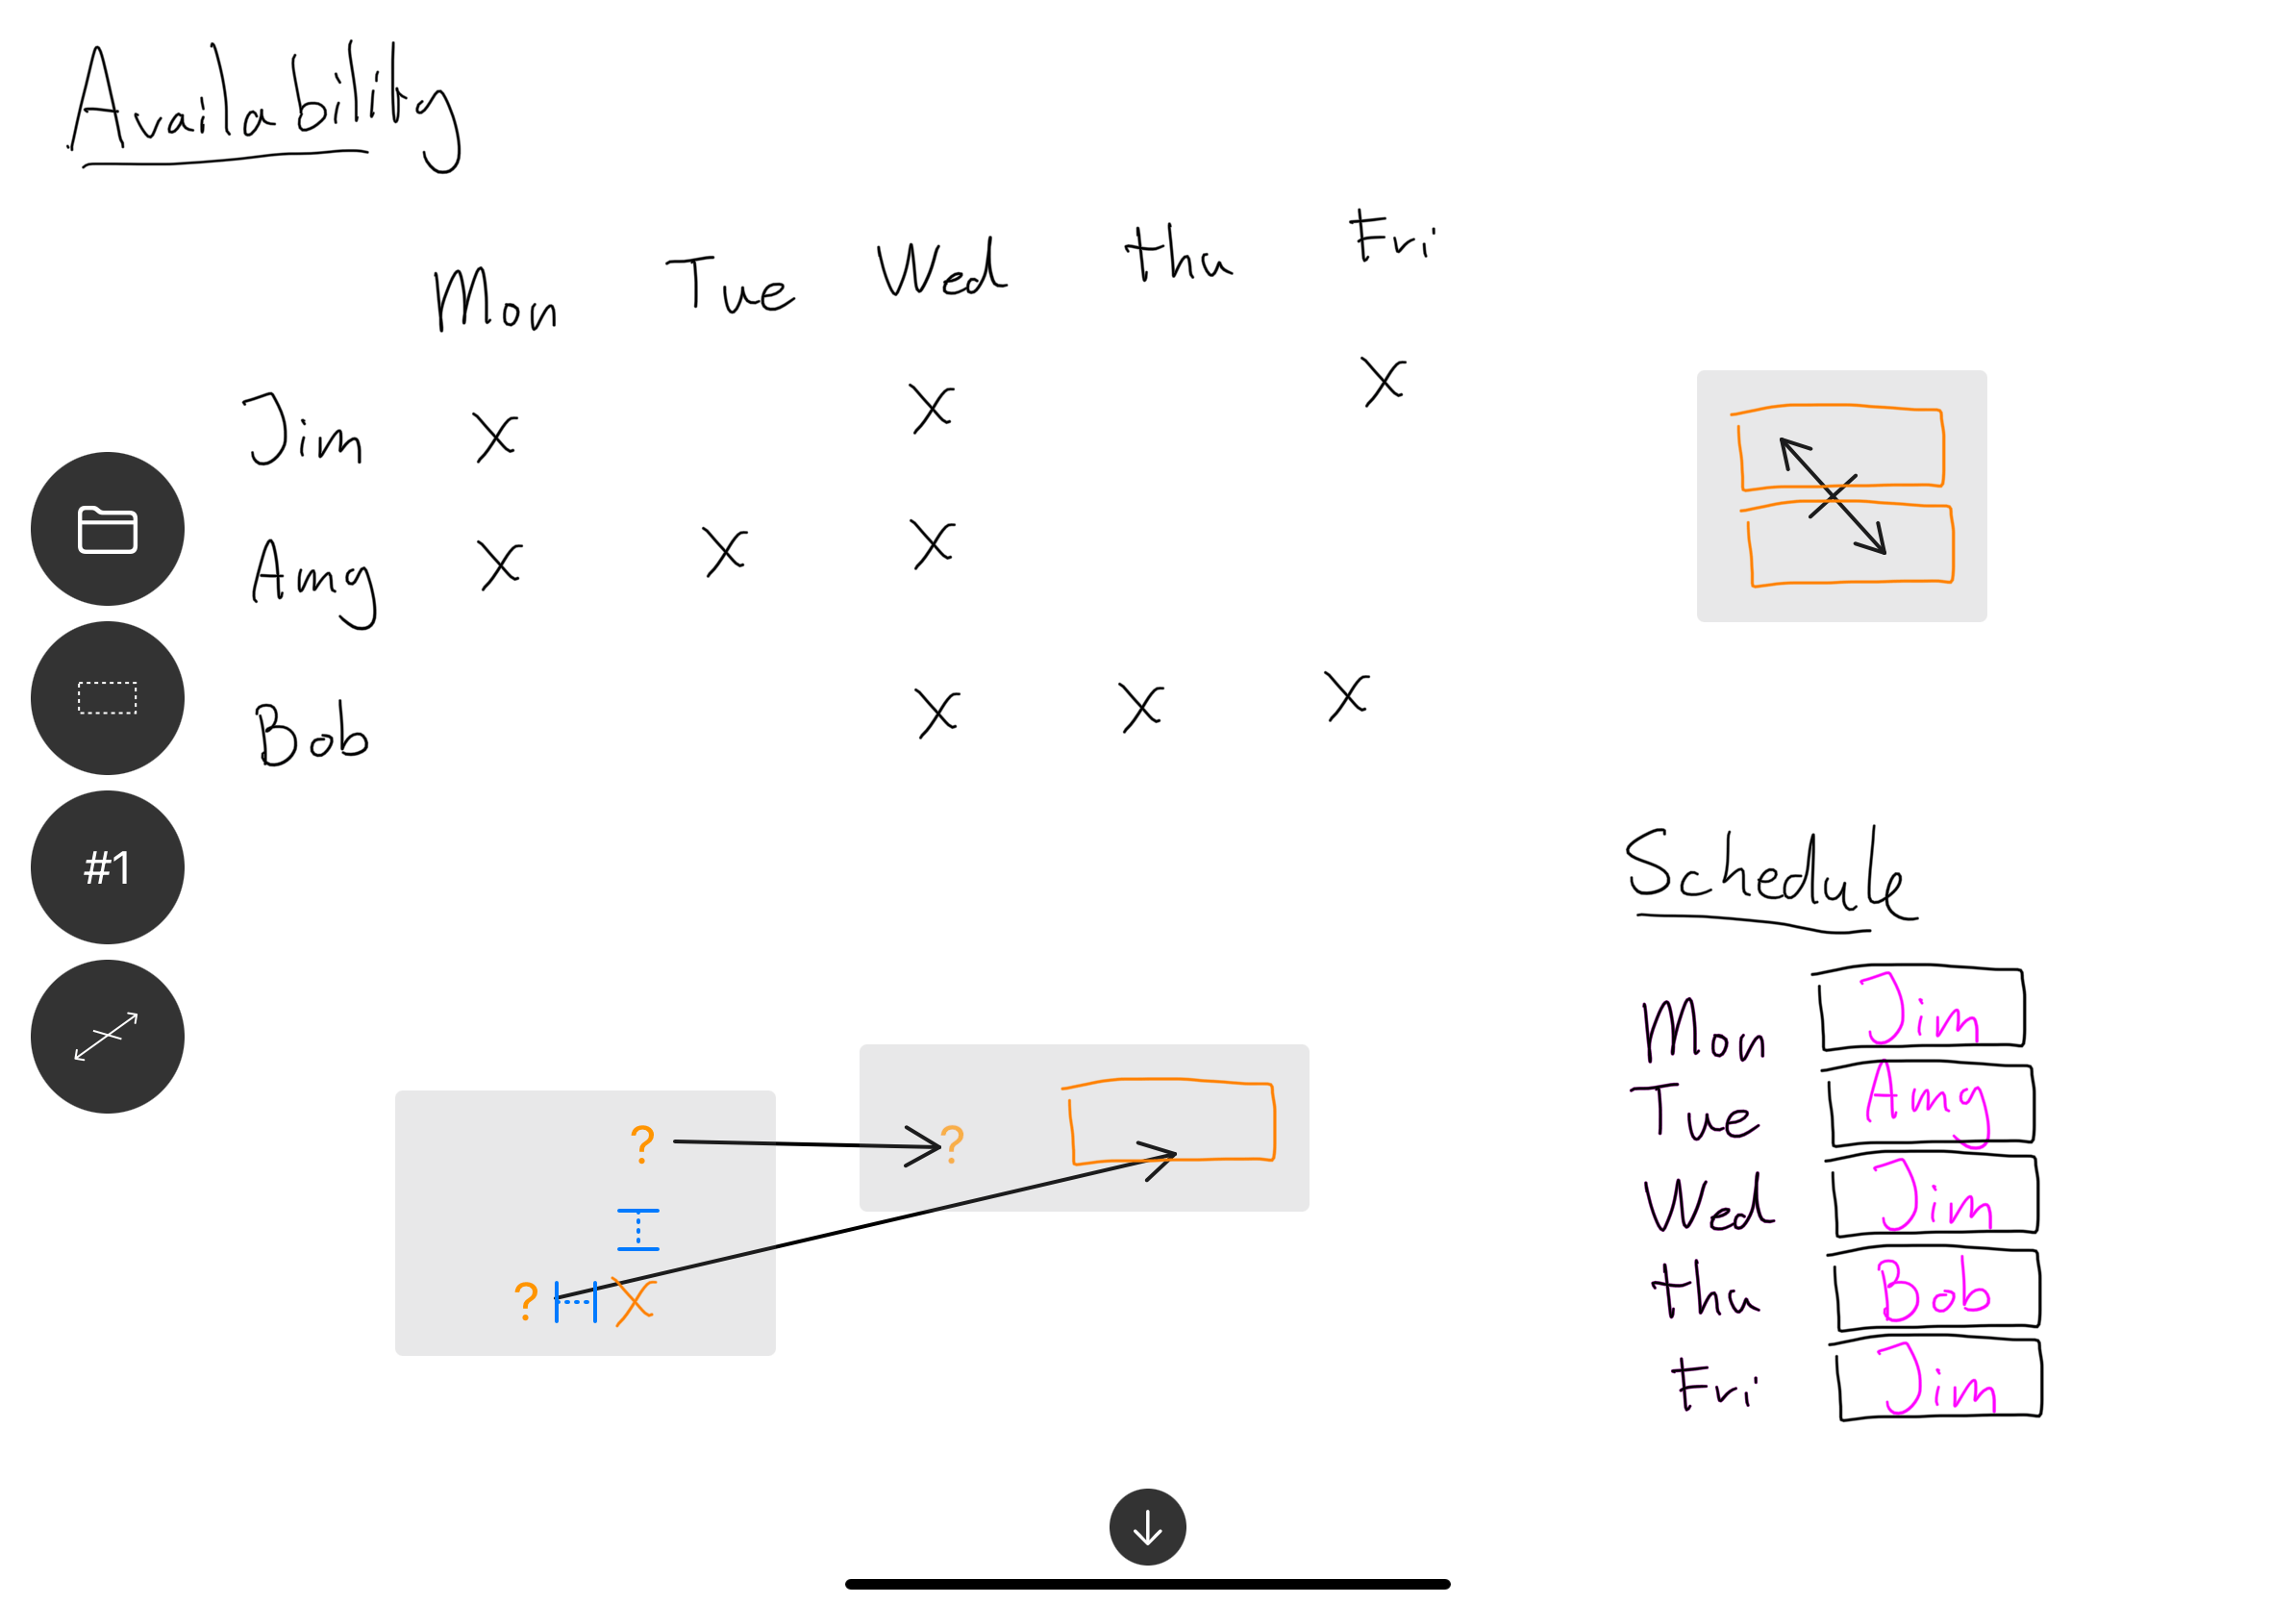
We only want to assign employees to days they are actually available. To do this we bind the wildcard matches on days of the week. We then use the names to fill in the boxes in the schedules. Untangle will show us all possible schedules based employee availability:
Resulting coffee shop work schedules based on employee availability.
The proposed schedules often have people working two days in a row—something we might like to avoid. We can set up a simple constraint, to make sure no two boxes in a row hold the same value:
Constraining consecutive not to hold the same value.
It’s worth noting that in this example, technically, all the information needed to solve the problem is already on the canvas. However, coming up with a valid solution still requires serious “System 2” level thinking, shuffling around symbols in your head. It feels great to have the system do this part for you.
Generative art
So far, all the examples we looked at, were about constraining the solution space—progressively going towards a small set of satisfying solutions. This is only a one part of the problem-solving process, which has two distinctive phases that feedback into each other—expanding, and collapsing:
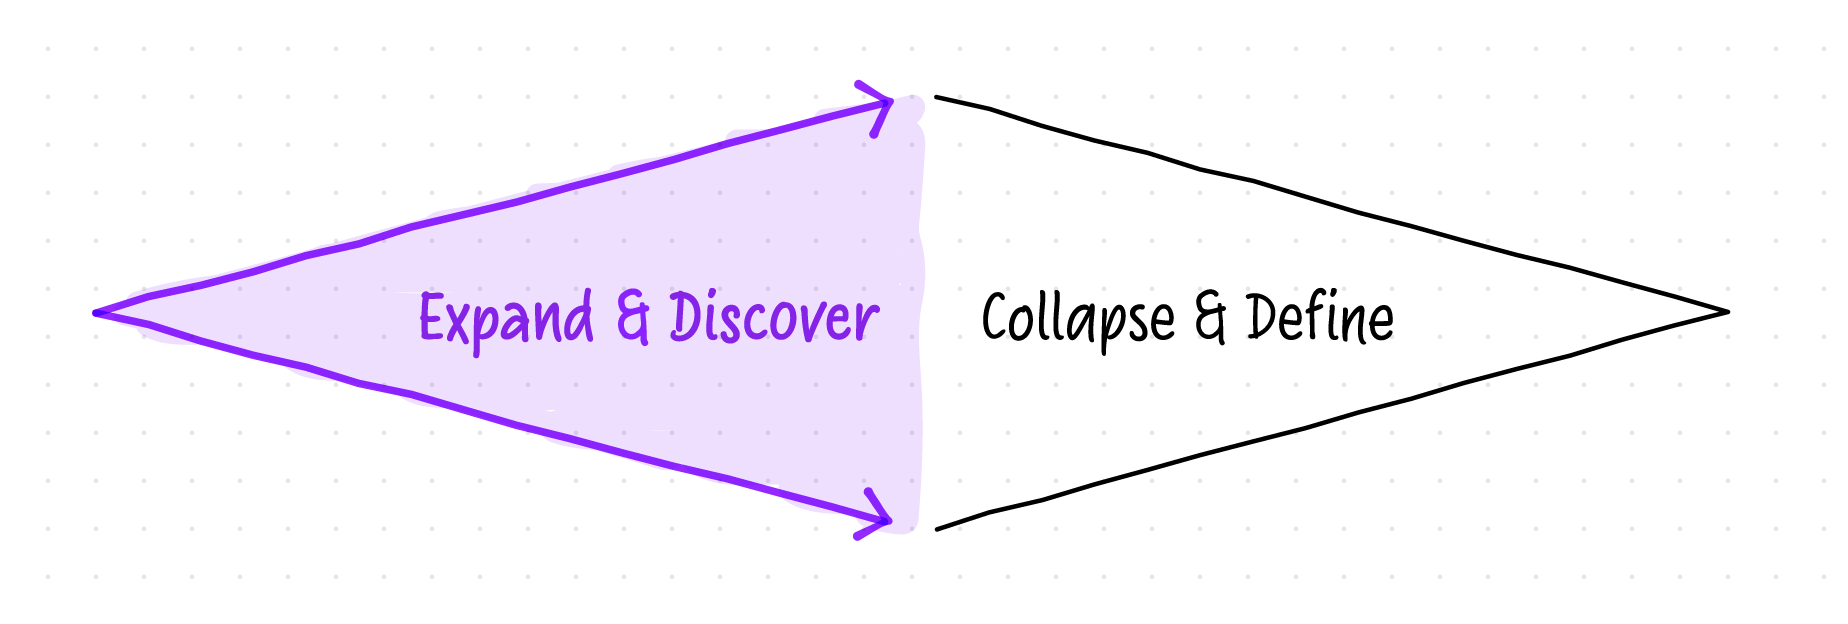
Expand and discover different possibilities, then narrow scope and focus.
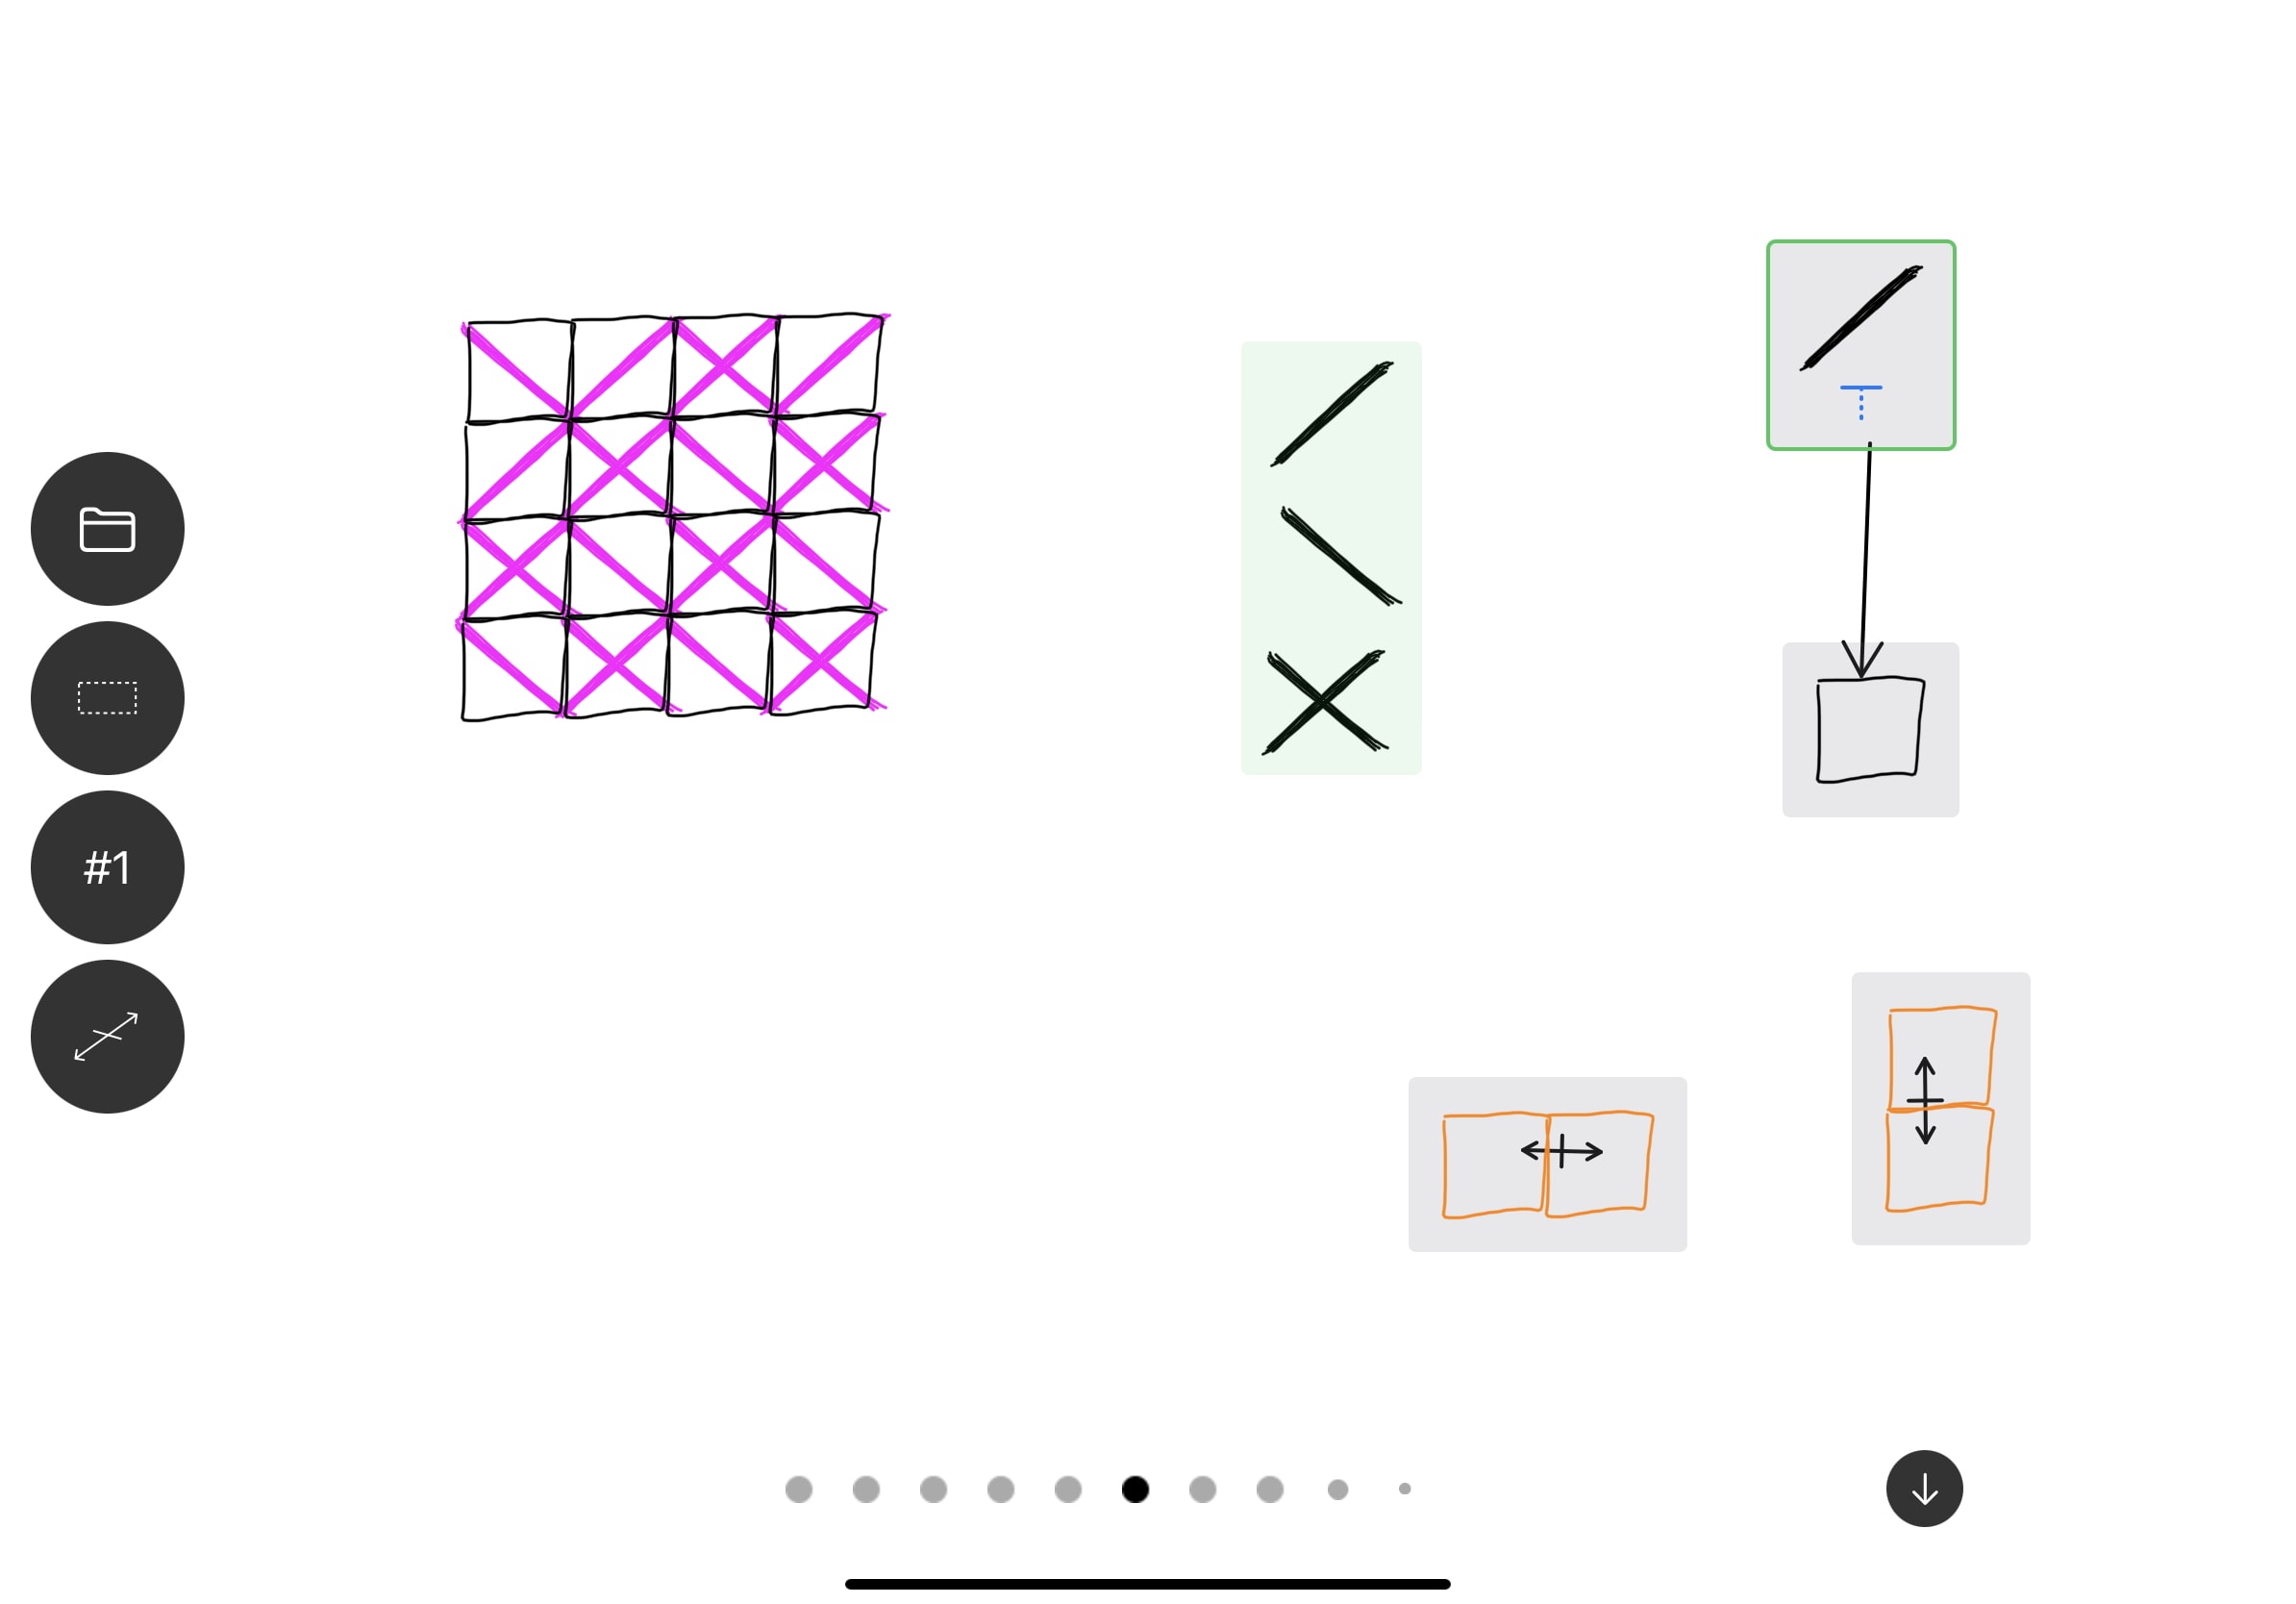
We can use Untangle’s primitives to force us to expand the possible solution space instead. Let’s illustrate this by recreating one of the most famous computer art pieces: 10 PRINT.
We can make a couple of boxes, two symbols, and fill all boxes:
Using spatial queries to fill all of the boxes with permutations of diagonal lines.
This already starts to look interesting, but we can get to more compelling results by adding additional constraints:
Forcing more interesting results by applying inequality constraints.
And of course, we can introduce additional symbols, and keep exploring the solution space:
10 PRINT variation using three symbols and two inequality constraints.
Recursive rewrites
We can apply the rewrites recursively, by flattening the pink results back onto the canvas, and turning them into black ink. This will, in turn, update the spatial queries, and generate a new set of results:
Progressively flattening solver results back onto the canvas to create basic 1D cellular automata.
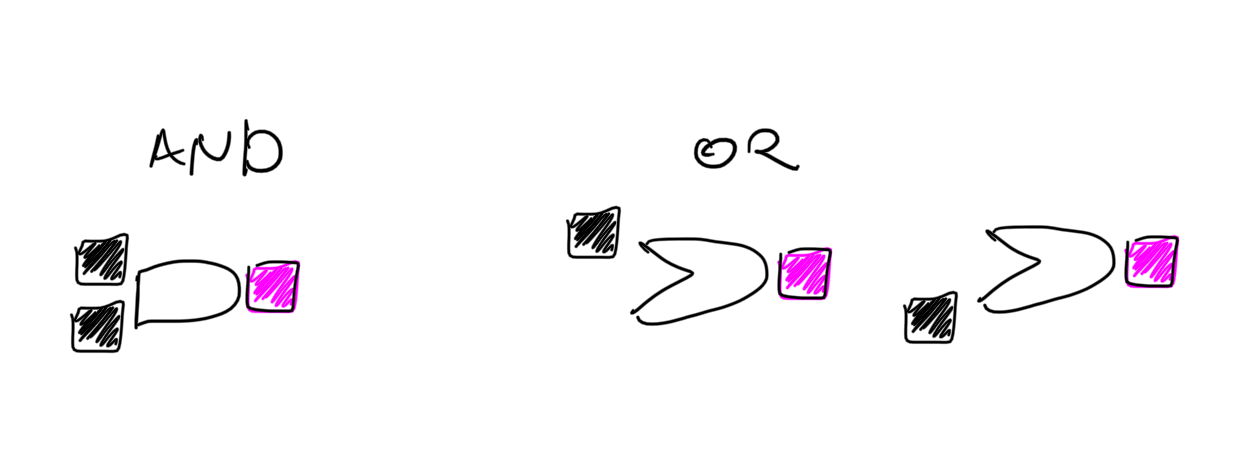
Recursive rewrites can be used in a lot of interesting ways. As an example, below is a recreation of a logic gates demo from Inkbase. We start by creating the symbols:
And the rules they follow:
Which shows us immediate feedback on the canvas:
We can then set up some logic gate networks, and propagate the values through them (by writing them onto the canvas) to get to the final result:
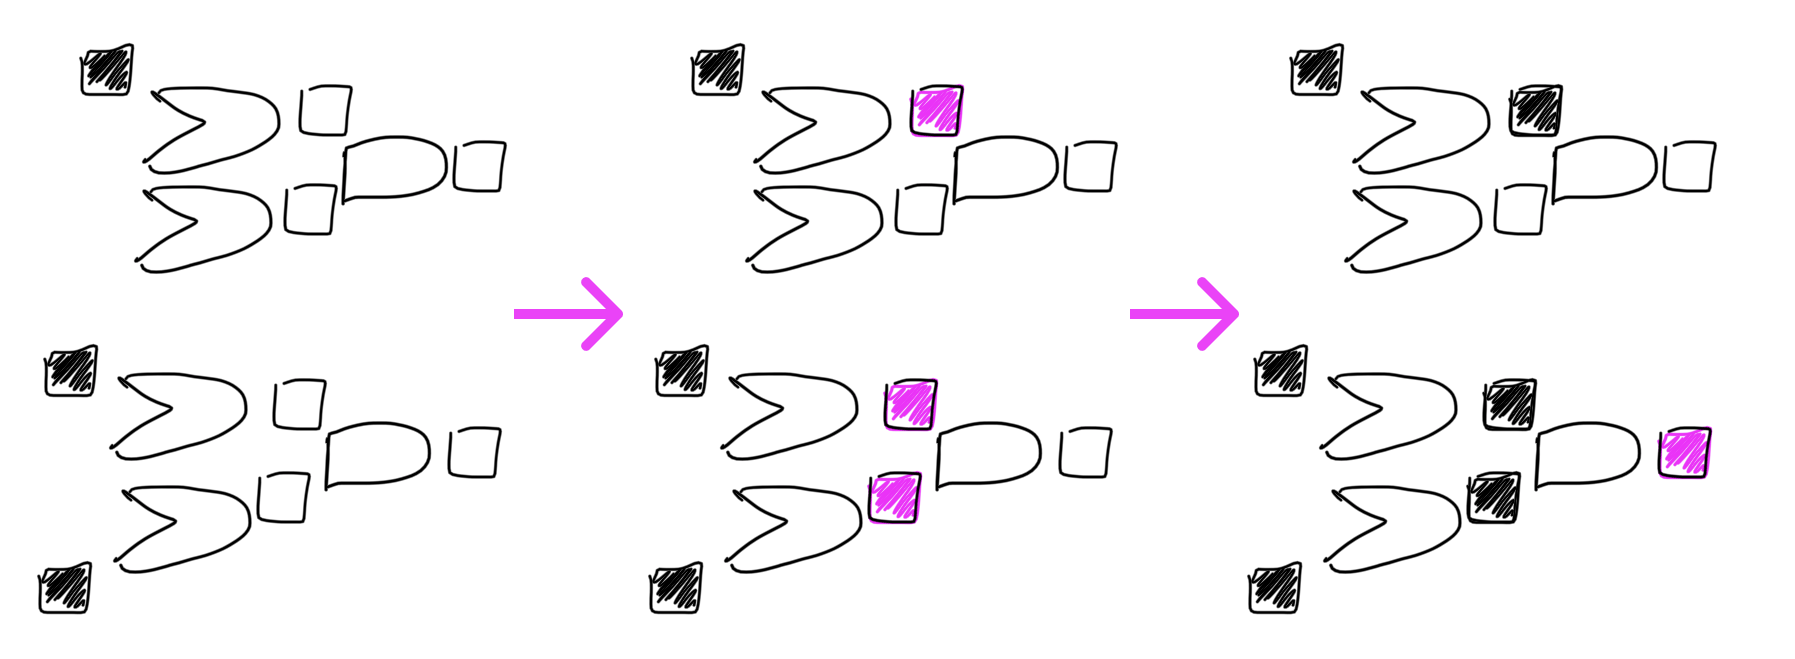
A process of propagating values through two logic gate networks.
Findings
We’ve used Untangle to solve the problems outlined above as we were building the prototype, to test our assumptions and intuitions. We also conducted several informal interviews with potential users with background in mathematics and logic programming. Here are some reflections from that process.
A smooth ramp from concrete to abstract helps form intuitions about the system
Symbols, queries, and arrows build up on each other:
- Arrows are a reified way of moving a symbol into a box manually.
- Spatial queries are a reified way of selecting things manually.
- Combining the two is a reified way of drawing multiple arrows between multiple symbols.
In this sense, each primitive is simply a way of expressing in more general terms what you could already do in an earlier step. Gradually climbing this ladder of abstraction helps build intuition about how the system behaves.
Informal solving is most useful for certain kinds of problems
There seem to be two dimensions of complexity for a given problem: a problem can have relatively trivial constraints but many elements that need to be solved, or can have a small number of elements but constraints that are difficult to satisfy.
There is a sweet spot where Untangle seems most useful. The dataset must be small enough to be manually drawn, but with constraints too complex to easily solve in your head. If the dataset is large, it takes too much effort to write it all down, and the tablet screen-size limits what can fit on the canvas. If the set of constraints is simple enough to keep in your working memory, you can often just solve the problem as you create its representation without additional help from the computer.
We found that the even a small number of overlapping constraints forces us to switch to effortful “System 2” thinking, and this is where Untangle shines, helping us think through a problem in an informal way.
Many problem representations look like tables
The way we naturally represent assignment problems tends to drift toward using tables:
Examples of table-like structures invented ad-hoc to represent specific problems.
Even though a structured approach—like a built-in table tool—might seem more appropriate to modeling these kinds of problems, freeform input feels important. The exact shape of the problem representation might not be clear initially, and sketchiness facilitates finding it. It feels good to build up to a table, rather than being prematurely forced into one.
Another possibility is that the provided spatial queries (column with symbol at top, row with symbol at left, table lookup, etc.) encourage drawing problems in grid-like structures. A rich area for future work would be adding more ways to query the canvas, which could lead to more diverse representations.
Hand-drawn input is well aligned with exploratory problem-solving
One of our motivations for hand-drawn input was to enable drawing symbols and elements that mapped closely to a particular problem domain. For example, you could draw chairs and tables for a seating arrangement. In practice, we rarely drew domain objects, instead favoring symbols like names, logos, or even dashes and dots.
However, hand-drawn input still felt much more aesthetically fitting than the vector version we tried early on:
Early iteration of Untangle using vector graphics and artificial symbols.
At the lab, we believe that the fidelity of the tool you use should be proportional to the maturity of the idea you’re working on. Being forced into crisp vector shapes for exploratory problems creates a cognitive dissonance between the fuzzy nascent problem in our head and the precise symbols on the canvas.
Fuzziness and live feedback contribute to a conversational feel
Untangle was designed to get the user to a result as fast as possible. Simply drawing a single arrow can generate multiple results. To find a satisfying solution, it is often not even necessary to add additional constraints. Instead, you can just scrub through proposed solutions to find one that makes sense. If you find a satisfying solution, you can simply stop working even if the results are underspecified.
In a similar vein, if the solver can’t satisfy your constraints, rather than showing an error message the system will attempt to ignore some constraints (relaxing the problem statement) to generate a technically incorrect solution. The interface will highlight the arrows that were ignored to generate each solution. In real-world contexts, we often aren’t trying to find the globally optimal solution, but rather just any reasonable one.
Spatial queries are also fuzzy. We don’t look for something “exactly 137px to the left”, but “roughly to the left”. This plays well with hand-drawn aesthetics, as you never create perfect sketches. Additionally, spatial queries highlight their matches directly on the canvas. This has two advantages: first, it helps explain what the query is doing—even if you have no idea of the underlying formalism, you can experimentally find out what is happening. Secondly, it makes it transparent when the imperfect matching algorithm doesn’t work as expected. You can always just wiggle your drawing a bit to get the system to recognize it.
Finally, arrows point to (and inside of) queries rather than of connecting to ports. This has a specific, informal, feel which meshes well with the fuzziness of other parts of the system, and is distinctively different from the feel of things snapping into each other.
Shortcomings
The system lacks clear semantics
Untangle’s “language” is unspecified and not very composable. The set of provided spatial queries is ad-hoc. We created new queries for problems we were solving in the examples instead of building them up from first principles. As a result, we can solve the examples nicely, queries are not composable, or abstractable—you can’t combine to the left and to the top to create the lookup query used in the coffee shop schedule, nor can you push the results from one query into another one to create reusable functionalities.
Additionally, creating these queries purely by example can be quite tedious—especially when it comes to selecting wildcard (?) configurations. It seems clear it would be better to create a match by example, then interactively refine it through direct manipulation.
Most importantly, it’s hard to intuit how the primitives behave beyond basic demos. For example, there is a subtle difference between constraining elements of the solution space and constraining elements of the match. Careful thought is required to discern the difference.
Turning ink into symbols is an unnecessary technical crutch
Untangle is a system for assigning candidate symbols to potential targets. In our experience, these symbols often consisted of many ink strokes, such as for people’s names. In order to assign these to a target, we need to recognize those strokes as being part of a grouping.
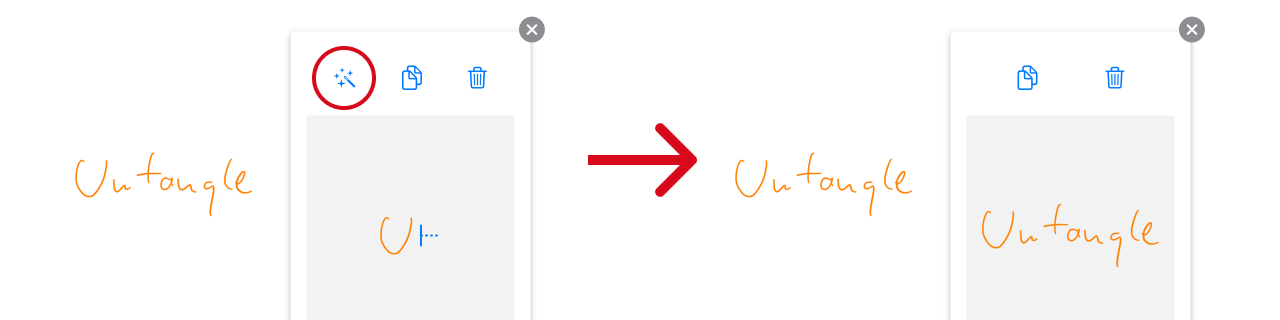
Using a magic wand to group multiple strokes into a single symbol.
In past research, we found that it was very difficult to reliably and unambiguously group ink strokes, or to recognize repetitions. For this project, we simply sidestepped the problem with a command to create a symbol out of a group of strokes. This was convenient for a research prototype but we feel this is unfortunate technical ceremony.
Similarly, when creating a drawing, we encourage users to re-use copies of the same target symbol to hint the solver system that those targets are related. Sometimes copying objects can be a fast and intuitive thing to do. Other times—especially when the shapes are simple—it feels more natural just to draw them again and have them match automatically.
The history of inferring specific user intent from ink gestures remains an open problem after many years of related work, including work on shape recognition for drawing programs and back to early stylus-based text input systems such as Palm’s Graffiti.
Some parts of the system lack visibility
A computing system should never leave a user feeling uncertain about whether the intent of the user has been understood. In Untangle, assignment arrows are freeform: they can exist with or without valid sources and targets. This meshes well with the fuzzy aesthetic, but our implementation doesn’t provide user feedback whether the arrow has actually connected the items on the canvas (other than the updated solutions).
For this specific example, it’s easy to imagine how to improve this. For example, by color coding arrows and connected spatial queries the same way we do for query matches. However, color coding query components as well as their matches creased a visually noisy rainbow canvas.
Finding the right queues and feedback for a system like this is a subtle task. There is a fundamental tension between maintaining a focus on the user’s input by avoiding unnecessary UI chrome and preventing confusion by providing sufficient feedback.
Responses from the computer are under-designed
In systems where users and computers collaborate, it helps to distinguish between user input and computed responses. In Untangle, user input is always black and we use pink to distinguish computed results from user-drawn strokes. We refer to this as the user voice vs the computer voice. Throughout our research, we often want the machine to respond and draw with us, but what is the “correct” way to do so?
Because Untangle limits user input to a single color, rendering results in pink makes the distinction immediately clear, but we worry this would become problematic in a more full-fledged system. We briefly explored rendering computed results using a different “pen” (for example a stylized marker), but that felt uncanny—the user’s input strokes, re-drawn exactly, but with a different aesthetic.
Small canvas artificially constrains the problem representation
In Untangle, the relatively small screen size and lack of support for canvas features such as panning or zooming limits the amount of data and the complexity of the problems you can represent. Drawing everything by hand also contributes to this limitation—it simply requires too much effort to draw hundreds of student names or create a staff calendar for an entire year. We are interested in how the experience of Untangle would evolve as we explored larger scale problems or more complicated representations. For example, one future project we’d love to see is “Untangle with external data”.
There’s no way to explore the solution space
One omission in this work is the limited ability to visualize the solution space. Yes, we can narrow down the solution space, by reifying a result (“Sam has to review Steve’s paper”), or by adding constraints (“the wildcard can’t be the same as the contents of the box next to it”), but while Untangle allows you to “scrub” through results, it only ever shows one result at a time.
In fact, the solution space is not a homogeneous list; there are recurring patterns. It would be interesting to explore visualizations that revealed clusters or branches of candidate solutions that share similarities, or how how different constraints “cut off” certain areas of the solution space.
Conclusions
With this project, we set out to discover what a non-bureaucratic theorem prover might look like. The traditional programming interface to a theorem prover is both strict and formal. Untangle shows a glimpse of a computational model with fuzziness at its core. Being able to hand-wave at a problem and get to results—often on the first browse through the solution space—feels wonderful and is a stark contrast.
Spatial queries provide a way to create structure on top of a freeform drawing. Instead of forcing problems prematurely into tabular form, you can start sketching the problem however feels natural. You then work with the system to query that diagram for a satisfying solution. In some cases, the final result may take the form of more traditional tabular data, but we found that building up to it from a freeform drawing (and not being constrained by it prematurely) allowed us to explore our ideas more naturally.
The combination of symbols, spatial queries, and arrows provides a nice on-ramp for abstracting logic. Rules can be built up out of simple examples, gradually adding assignment arrows or replacing those arrows’ concrete sources and targets with spatial queries. We feel this conceptual buildup is very promising and points at a possible way of solving the repetition problem described in the Crosscut essay.
Untangle is part of our “programmable ink” track of research, continuing from previous projects Inkbase and Crosscut. We remain optimistic about systems in which you directly manipulate the representation of the problem at hand, and that remain alive and reactive. This combination allows you to improvise and rely on intuitions, instead of having to switch your thinking mode to one of effortful logical computation. We see here an exciting glimpse of conversation with a dynamic medium—sketching at the speed of thought, and collaborating with the machine.
We welcome your feedback: @inkandswitch or hello@inkandswitch.com.
Thank you to everyone who offered feedback and guidance throughout the project: Peter van Hardenberg, James Lindenbaum, Todd Matthews, Kevin Lynagh, Geoffrey Litt, Scott Jenson, Joshua Horowitz, Patrick Dubroy, William Taysom, Daniel Krasner, Ivan Reese, Paul Shen, Max Schoening.