Motivation: comparing scenarios
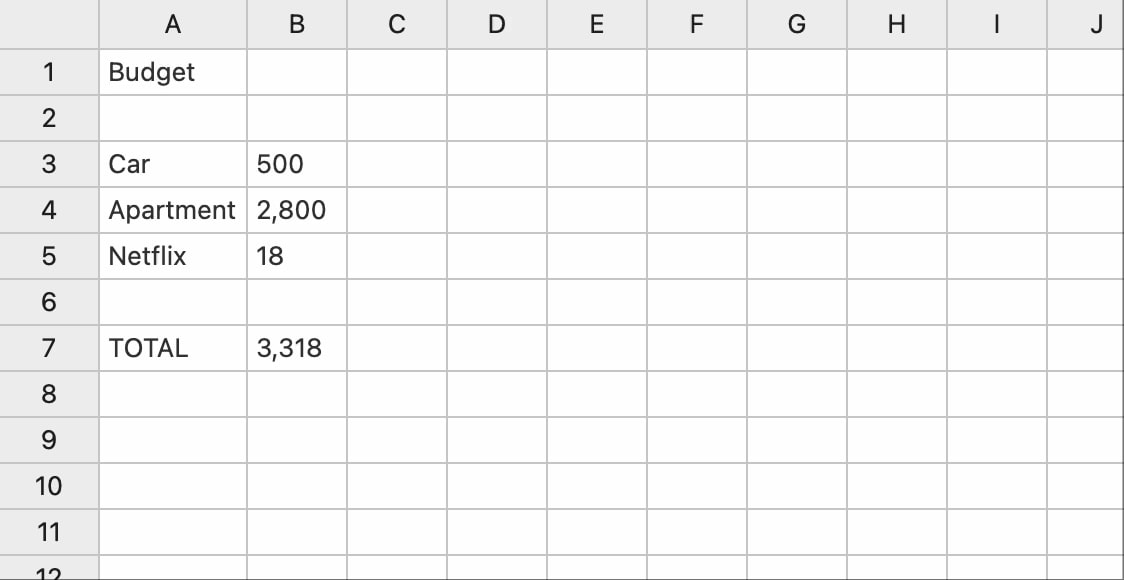
Suppose you’re moving to a new city, and you want to figure out how much you can afford to spend on your car, apartment, and other essentials each month. You start by making a spreadsheet that sums up the various line items:
Now, you want to consider a few scenarios for possible cars and apartments. How might you compare those scenarios in today’s spreadsheets?
One thing you can do is toggle, by temporarily entering different values into a cell:
Toggling is straightforward because it doesn’t require restructuring the spreadsheet, but it has a key drawback: you only get to see one scenario at a time! This makes it difficult to compare scenarios, and even more difficult to answer questions about all of the scenarios in aggregate, like what is the range of possible values for B7 (a cell whose value is computed by a formula).
Another option is to restructure by adding more columns to the sheet:
Restructuring does let you compare multiple scenarios at the same time, but it has its own drawbacks. It’s more work than toggling, because you need to pause and edit the layout. And it’s easy to run out of space—even in this small example, if you wanted to consider two possible cars and three possible apartments, your spreadsheet would grow rapidly.
Ambsheet: a spreadsheet for comparing scenarios
Neither of the options above is fully satisfying. What if instead you could directly tell the spreadsheet that you’re considering multiple values for the price of the car? In our Ambsheet prototype, you can do just that:
Amb values
The new value of B3, {500,1200}, means either 500 or 1200. We call this an amb value, and it represents one dimension in our possibility space. (Amb is shorthand for “ambiguous”, and is a reference to the nondeterministic evaluator from Abelson and Sussman’s Structure and Interpretation of Computer Programs.)
Amb values flow through the computation just like regular values and don’t require any special treatment in formulas. Cell B7, whose formula is SUM(B3:B5), now evaluates to either $3,318 or $4,018—this is what your total monthly spend will be if you decide to lease the car that costs $500/month or the car that costs $1,200/month, respectively.
If you’re willing to spend up to a total of $5,000 per month, you may also want to consider apartments that are larger and/or in nicer neighborhoods. In our ambsheet, all we have to do is change B4 to an amb value:
Now the total monthly spend (cell B7) has 6 different values, one for each possible scenario:
- in the 1st one, we leased the $500/month car and rented the $2,800/month apartment,
- in the 2nd one, we leased the $500/month car and rented the $3,700/month apartment,
- … and so on.
We say this possibility space has two dimensions because there are two different amb values where we are making a choice. We can visualize the possible values of B7 in a 2-dimensional table:
Within each scenario, an ambsheet operates like a normal spreadsheet—the SUM formula only sees “regular” (non-amb) numbers. Behind the scenes, the ambsheet’s evaluator takes care of enumerating all possible scenarios and computing the formulas for each one.
Ambsheets aren’t limited to 2 dimensions. For example, if you’re choosing among different Netflix plans, you could turn the last budget item into an amb value, resulting in a three-dimensional possibility space. This is more flexible than doing restructuring in traditional spreadsheets, where you’re limited to a two-dimensional grid.
Filters
Enumerating scenarios is just the first step in exploring a decision. When exploring a large set of scenarios, it’s also helpful to have filters to focus your attention.
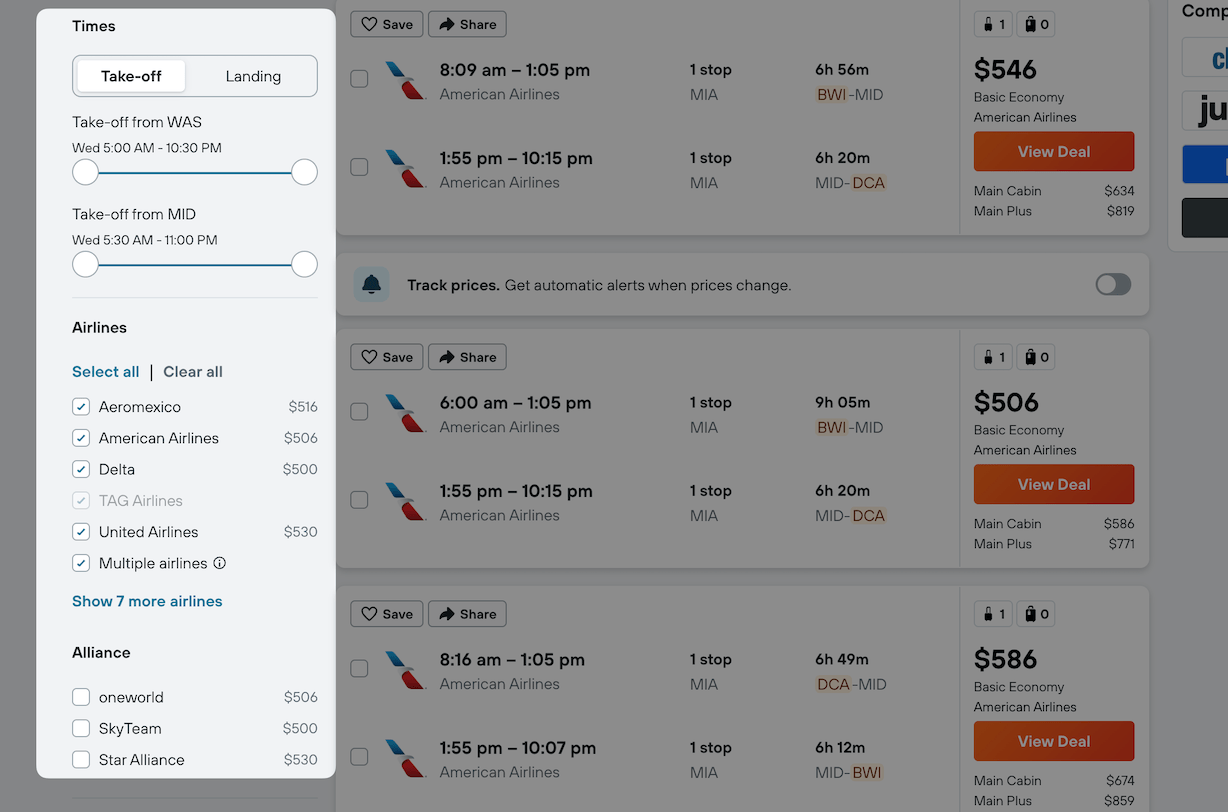
This is a familiar concept on many websites—for instance, on the flight search website Kayak, you can start with a list of thousands of flights, and then filter down to the ones that meet your needs: “a nonstop flight, leaving before 11am, in economy class”.
In Ambsheet, users can similarly filter a list of scenarios with a sidebar. For example, maybe you only want to consider scenarios that involve the cheaper car:
Now you can see that some of the values in cell B7 (TOTAL) are greyed out, indicating that they’re no longer possible. We can similarly filter on the apartments by selecting only the two higher-priced options, and we see that the set of possible values in cell B7 shrinks once again:
So far these conclusions have been fairly obvious. But filters in Ambsheets also support more interesting analyses because you can filter on any cell, including the outputs of computations.
To illustrate this, let’s imagine that your budget needs to be under $4200 per month, and you want to know which combinations of car and apartment are viable options given that constraint. There’s a nice pattern you can use for this: write a formula labeled “can afford” that evaluates to true or false, and then use it to filter down to only scenarios that we can afford:
We’ve filtered the output cell, and now the ambsheet shows us which inputs correspond to those outputs. We can see that the two more expensive apartments have been greyed out—that’s because there’s no scenario where we can choose one of those apartments and still satisfy our affordability filter.
Writing amb values
So far we have written every choice as an “amb literal” (e.g., {500,1200}) that specifies each possible value explicitly. This syntax is convenient when there are only a few possible values, but gets unwieldy quickly as the number of possible values increases.
Our language supports other syntactic forms that make it easier for users to write higher-cardinality amb values.
Ranges
X to Y by S denotes an amb value that contains every number X+i*S between X and Y, inclusive, where i is a non-negative integer. For example:
1 to 10 by 2is equivalent to{1,3,5,7,9}0 to 3 by 0.5is equivalent to{0,0.5,1,1.5,2,2.5,3}
As a convenience, the user can write X to Y as a shorthand for X to Y by 1. For example:
1 to 10is equivalent to{1,2,3,4,5,6,7,8,9,10}
Distributions
It’s reasonable to think of amb values as collections of possible values. Allowing these collections to contain duplicates–i.e., making them bags instead of sets–makes it possible for amb values to represent arbitrary distributions. For example, the amb value {1,1,2} represents a distribution in which a 1 is twice as likely as a 2. As we’ll see in the next section, this enables a (naive) form of probabilistic programming in ambsheets.
Our language has specialized syntax that makes common types of distribution easier to write. For example, normal(M, S, N) creates an amb with N possible values which are samples taken from a normal distribution with mean M and standard deviation S.
Ambify
Last but not least, ambify(cellRange) creates an amb whose possible values are the values of the cells in the provided range. For example, in the budget ambsheet from the previous section ambify(A3:A5) is equivalent to {"Car","Apartment","Netflix"}. “Ambify” is particularly useful in spreadsheets that contain tables, as we’ll see in the next section.
Planning a wedding in an ambsheet
Everything we’ve shown so far scales nicely to more complex spreadsheets. For example, imagine you’re budgeting for a wedding in an ambsheet.
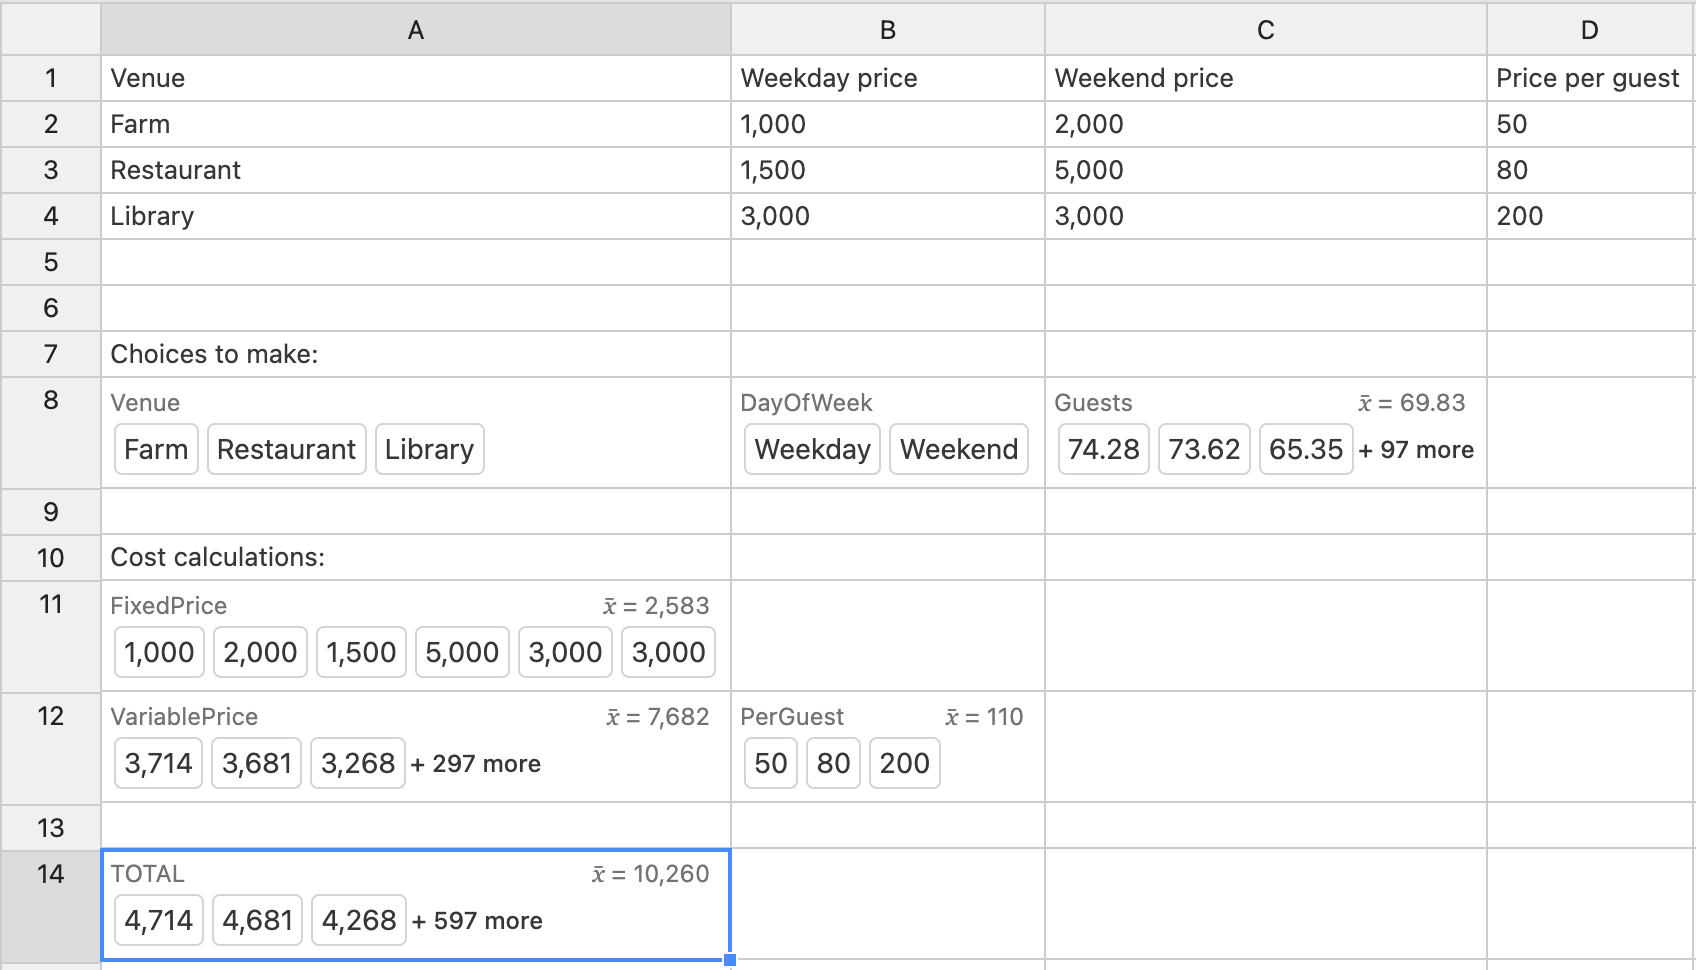
You start by making a table that contains the information that is necessary to calculate the cost of the wedding (cells A1…D4).
Next, you create multi-valued amb cells representing choices and unknowns:
- the venue (cell
A8):{"Farm","Restaurant","Library"}, or better yet,ambify(A2:A4), which gets the alternatives directly from the table.
- whether it’s on a weekend or weekday (cell
B8):{"Weekday","Weekend"}
- the number of guests (cell
C8):- Since it’s impossible to predict exactly how many guests will show up, we’ll model it as a distribution.
normal(70, 5, 100)
Now you write a series of formulas that compute the total cost of the wedding (cells A11, A12, B12, and A14). There is nothing unusual about these formulas, just a couple of calls to VLOOKUP() and some straightforward math. For example, here’s the formula for the “fixed price” calculation in cell A11:
VLOOKUP(A8, $A$2:$D$4,IF(B8="Weekday", 2, 3))
After writing the cost formulas, you see all of the possible values for the “total” cell (A14). Now you can repeat the same exercise as before: filter on that cell to consider affordable choices. In this case we’ll use a different UI for filtering: a histogram with draggable slides, which helps you see the range of values as you filter. But the underlying logic is exactly the same as before: you’re picking a subset of outputs, and the tool shows you which inputs correspond to those outputs.
Filtering the wedding ambsheet instantly provides a picture of which wedding venues and dates are realistic choices at different price points. As you set an upper limit on the budget, you can see in the table view at the bottom right that the cells in the Library column greyed out, telling you the Library isn’t viable as a venue if you want to keep the wedding under a certain price.
Design
We co-designed the Ambsheet programming language and environment to support not only an ergonomic end-user experience, but also to make it easier for ourselves and others to extend the system in useful ways. In this section we briefly explain some of the design decisions we made in support of those goals.
Language
We implemented an interpreter that uses continuation passing to evaluate each cell once for every applicable scenario. Whenever an amb is encountered during evaluation, the interpreter calls the continuation for every possible value of that amb. Computed values are also tagged with provenance information so that the user interface knows which scenario is associated with each value.
As mentioned earlier, operators and standard library functions operate on regular scalar values, not ambs. Looping over ambs is handled by the language core. This separation of concerns makes it straightforward to implement new standard library functions—including reuse of existing code or third-party libraries—without worrying about performing nested loops inside of each function.
Other than the handling of ambs, Ambsheet is an unremarkable spreadsheet language that supports numbers, strings and booleans as primitive types, and a variety of standard functions such as SUM and VLOOKUP. While it is missing many of the functions available in a full spreadsheet program like Excel, adding those would be conceptually straightforward.
Environment
The Ambsheet environment is mostly a traditional spreadsheet UI, with some extensions for working with ambs. As seen above, individual cells can display ambs inline, and there is also a sidebar that shows various detailed views of the currently selected cell.
To support the display of ambs, Ambsheet has an extensible framework for value viewers. There are many ways to view a cell which are more or less appropriate depending on the number of unique values in the cell, the number of dimensions, whether the cell contains numeric vs. categorical data, etc. Sometimes a view makes no sense at all for a given cell. In other cases there may be many views that each reveal different notable features of the data in the cell.
So far we have built several value viewers in Ambsheet:
- a histogram for seeing the distribution of numeric data
- a dependency view for seeing the dimensions that are relevant to a given cell
- a table showing aggregated data along two dimensions chosen by the user
- a “stacks” view showing the number of times that each unique value occurs (which is only useful when there is a relatively small number of unique values)
Each value viewer defines not only a UI component but also a shouldRender function that determines how well-fit the view is for the data in the currently selected cell. The system can then sort the available views by their shouldRender results to determine how to display any given cell.

Limitations and Ongoing Work
We have written several Ambsheet prototypes, each with a different form factor and approach to execution.
Ambsheet v1
All examples shown up to this point were written in our first prototype, Ambsheet v1, the design of which was the topic of the previous section.
The spreadsheet form factor we chose for v1’s user interface is already familiar to many users, and handles semistructured tabular data well. However, it has some drawbacks:
First, it is difficult to see the entire program at once. Traditional spreadsheets alleviate this problem to some extent by showing the full results of computations; however, an Ambsheet has much more data to show (even examining the contents of a single cell can take some time!), making it harder to grasp the nature of the entire program.
Second, there’s no natural way to show individual scenarios in a way that correlates values across multiple cells.
The approach to execution we used in this protype—exhaustively evaluating all scenarios—also imposes limits on scalability. In our experience, interactions in ambsheets with up to a few thousand scenarios felt fluid with sub-second latencies, but starting at ~10k scenarios we incurred a noticeable lag. Because v1 computes Cartesian products, it’s easy for the number of scenarios to grow rapidly.
Ambsheet v2
Ambsheet v2 is an attempt to address the limitations of our first prototype.
Improving scalability by sampling
To improve scalability, we replaced our first prototype’s exhaustive evaluation with a new approach based on sampling.
Instead of evaluating every possible scenario, our v2 prototype selects thousands of sample scenarios (by picking a value at random from each amb), then evaluates the formulas in each of these scenarios. The idea is that by analyzing a large set of sample scenarios, the user can build a pretty good understanding of a huge (potentially infinite!) space of possibilities.
To avoid the lags we experienced while interacting with large ambsheets in v1, the new prototype’s “engine” selects and evaluates sample scenarios incrementally, handing new results over to the UI as they become available. So even if 100k+ scenarios are being processed, visualizations will always show the latest information available, and the UI will remain responsive (e.g., the user never has to wait to make changes).
Note that v2’s random selection of sample scenarios requires special care. Think about how disorienting it would be if the set of selected sample scenarios would change every time you edited a formula. This would make it impossible to see the effect of your change in aggregate (they’re different scenarios!) and locally (the scenario you were just looking at has disappeared!). To provide a better live programming experience, our prototype remembers the set of sample scenarios that was used in the previous run (but not the results of formulas) so long as the user hasn’t made any changes to ambs. Adding, removing, or changing an amb, on the other hand, does result in the selection of a new set of sample scenarios.
The use of sampling in v2 has enabled us to build ambsheets that would have been impossible with the previous prototype, like the model of poker shown in the following section. It also created opportunities that we plan to explore in future work, such as (i) adding support for continuous distributions and (ii) the application of more sophisticated approaches to sampling—like importance sampling and Markov chain Monte Carlo—that can [more] efficiently generate sample scenarios that satisfy a given set of filters (e.g., “my opponent has a full house”).
Live document form factor
To improve on the aforementioned drawbacks of our v1 prototype, we are exploring a new “live document” form factor for Ambsheet that replaces the spreadsheet grid with a text field for the program, accompanied by a table view where each column represents a scenario. For example, the wedding example from above looks like this in the document form:

A “document” view of an Ambsheet program. The UI bears some resemblance to Soulver, but with multiple columns for multiple scenarios.
Based on initial results, we think this view holds promise because it makes it easier to see the entire contents of individual scenarios column-wise, making it much easier to debug and understand certain simulations. For example, when viewing the results of a poker simulation, each column represents a single hand.

Ambsheet-backed applications
Another area of ongoing work is wrapping ambsheet models in user interfaces tailored to more specific use cases. This could include a poker simulation visualized on a spatial canvas that looks like a poker table:

Or it could look like a simple minimal UI with inputs and outputs. We made one such UI for predicting the due date of a baby, given the known statistical likelihoods:

In all of these cases, the full power of the Ambsheet language would remain available to the user if desired. For example, the birthday predictor “application” shown above is just a thin wrapper around an Ambsheet document:

Related Work
Excel’s What-If
The What-If Analysis feature in Microsoft Excel solves a similar need to Ambsheets, but with some key differences.
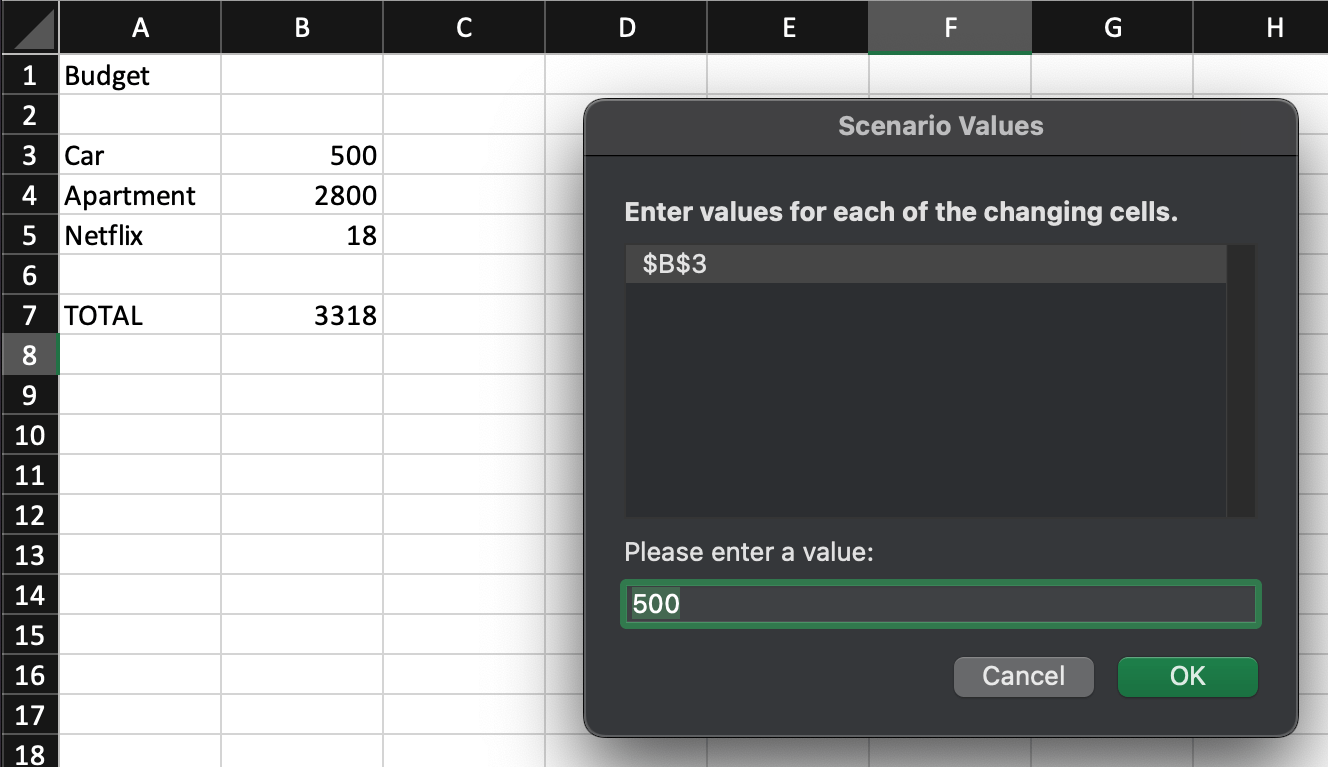
First, the UI for What-If Analysis is not integrated into the spreadsheet itself—you need to open a separate mode to enter cell values or view the possible scenarios. In an ambsheet, you can start exploring scenarios right within the sheet itself.
More fundamentally, Excel requires the user to manually enter a scenario for every combination of multiple variables—in the simple example above, exploring 2 cars, 3 apartments, and 2 Netflix plans would require entering 12 scenarios, with names like “Cheap Car / Medium apartment / Premium Netflix”. In contrast, Ambsheet automatically computes all combinations of the three amb values.
Squiggle
Squiggle is “a simple programming language for intuitive probabilistic estimation”.
Squiggle shares the same general goal as Ambsheet. It also has many language constructs for letting users express probability distributions—such as writing X to Y to express 90% confidence that a value is between X and Y—which we think could provide inspiration for expressing distributions in Ambsheet.
Currently the main difference between Ambsheet and Squiggle is the spreadsheet form factor used in Ambsheet, which provides a familiar data-first live programming experience.

Subjunctive interfaces
Aran Lunzer coined the idea of subjunctive interfaces:
The aim of the ‘subjunctive interface’ concept is to make broader searches more manageable, by letting users propose multiple alternative values for each parameter where normally only a single value can be supplied, and by supporting the viewing and comparison of the various resulting outcomes.
Ambsheet suggests a principled approach to building subjunctive interfaces: building programming languages and environments that support ambs as first-class citizens. Lunzer’s work also suggests some ideas for guiding further development of Ambsheet, such as allowing users to combine complementary parts of different solutions.
Soulver
Soulver offers a live notebook interface for performing simple math computations. We are inspired by Soulver’s natural language syntax, which accommodates a variety of units and has a design goal of “[making] common tasks involving numbers more natural for the human brain.” The notebook interface we are now exploring for Ambsheet resembles a Soulver notebook—except instead of just a single column of results, it shows many columns representing possible simulated outcomes.

Conclusion
In this paper, we have contributed:
- an extension to traditional spreadsheet formula languages that accommodates ambs with multiple values
- a UI for defining, viewing and analyzing ambs in a spreadsheet view
The invention of the original spreadsheet empowered many people to use computers for mathematical modeling. Our goal for the Ambsheet project is to gently extend spreadsheets to enable new forms of scenario analysis and probabilistic simulation, while retaining accessibility for a broad group of non-expert users.